Global Financial Crisis
by Professor Throckmorton
for Intermediate Macro
W&M ECON 304
Slides
Introduction
Many economic recessions are preceded and accompanied by a financial crisis.
A financial crisis features an over-supply of credit, over-leveraged firms and banks, and asset bubbles, which eventually collapse and result in bank and firm failures.
If the financial crisis is severe enough, then it may trigger significant declines in aggregate income and employment, i.e., an economic recession.
Both the U.S. Great Depression (1929-1933) and Great Recession (2007-2009), or Global Financial Crisis, are recessions of this type.
For the Great Depression, an over-supply of credit fueled a stock market bubble, while for the Great Recession the bubble formed in the housing market.
Both recessions originated (mostly) in the United States but had a global impact because the U.S. is at the center of the global financial system.
Housing Bubble
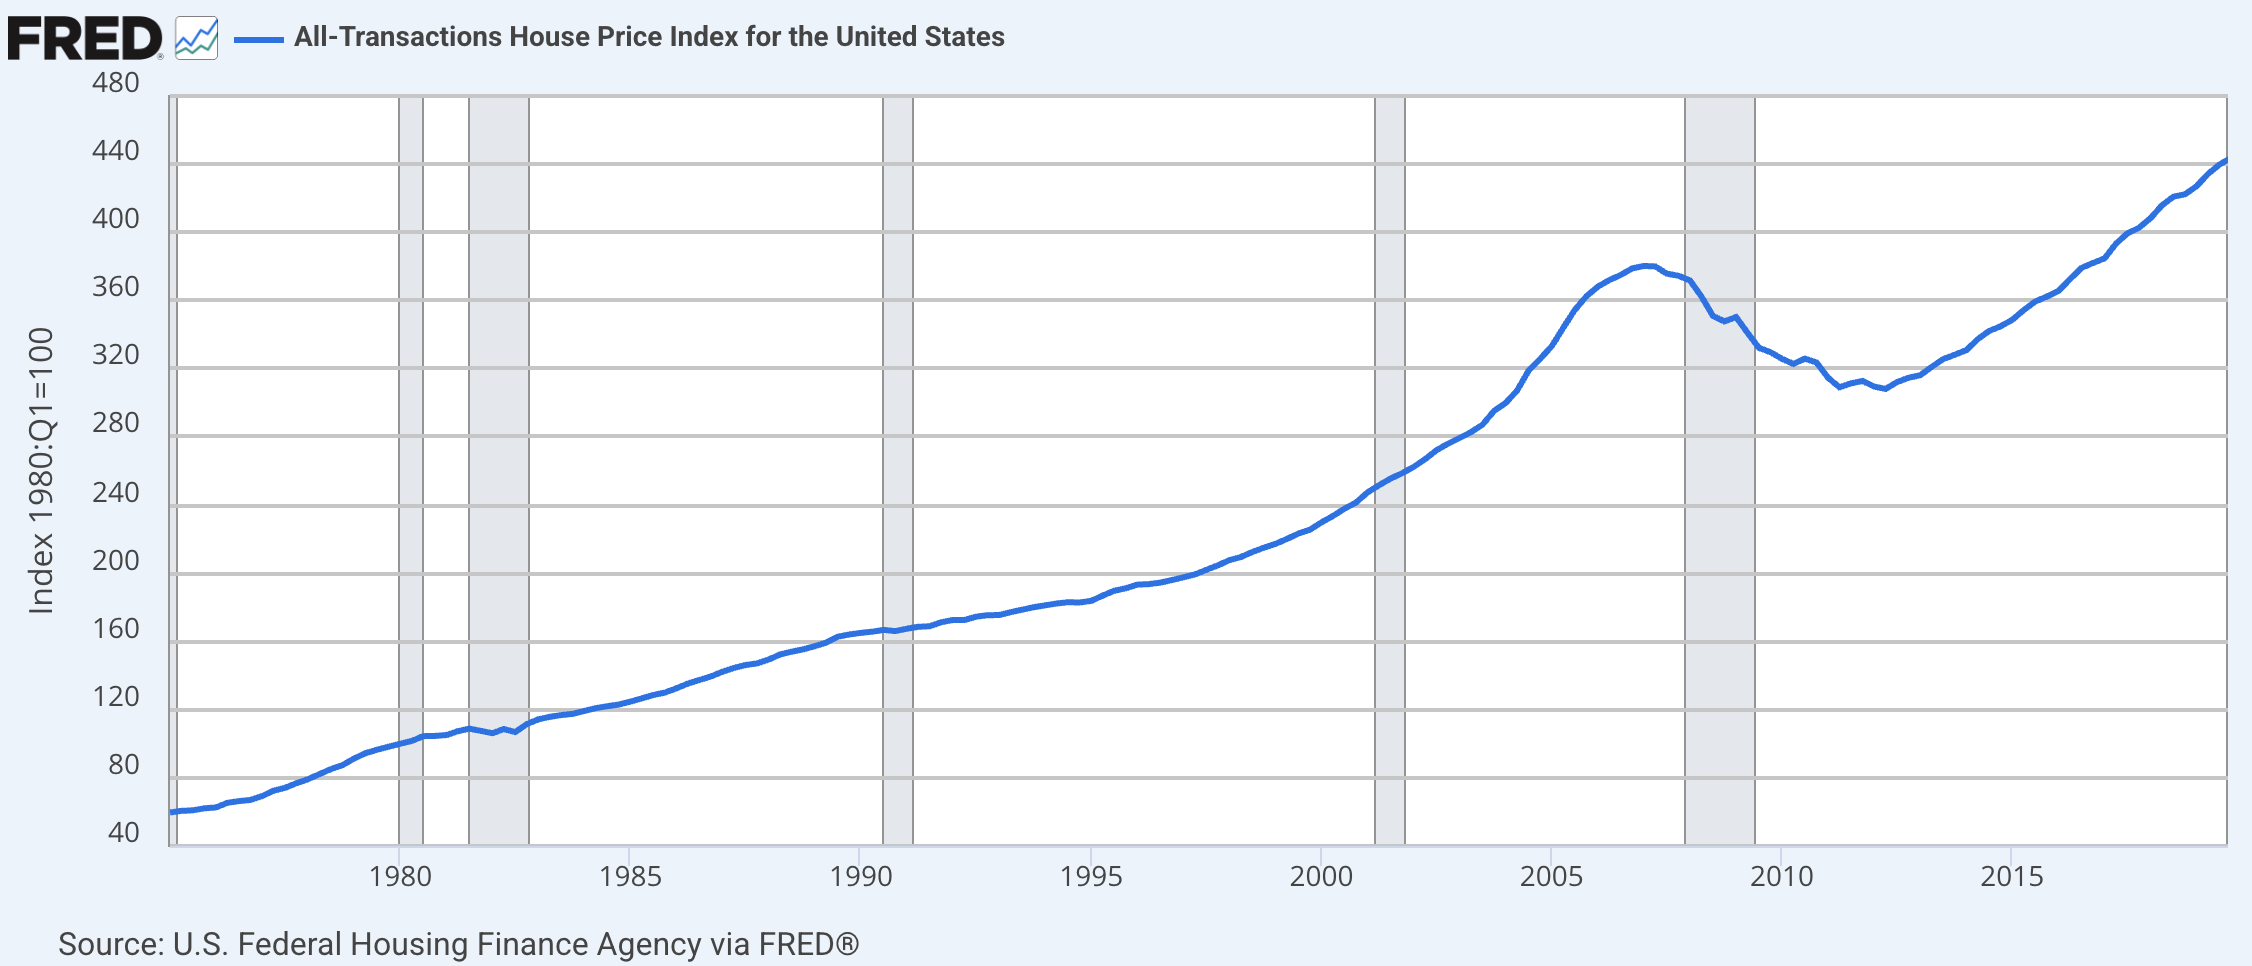
U.S. home prices rising nearly linearly until late 1990s
By 2005, home price bubble is forming
By 2011, market makes full correction, reverting back toward pre-2000 linear trend
Mid-2010s, home prices increasing as labor market recovers and economy grows
Q: Why did the housing bubble form?
After the tech bubble and early 2000s recession, the Fed lowered the short-term interest rate to 1%, which decreased mortgage interest rates.
Housing demand was fueled by subprime mortgages, which made up about 20% of new mortgages by 2006.
Mortgage lenders were willing to make these riskier loans because
housing serves as collateral and can be sold (foreclosed) in the event of default
housing prices are usually increasing, so value of mortgage is decreasing relative to house value over time
financial innovations coupled with an over-supply of credit allowed lenders to sell the mortgages and unload the risk
Housing Supply
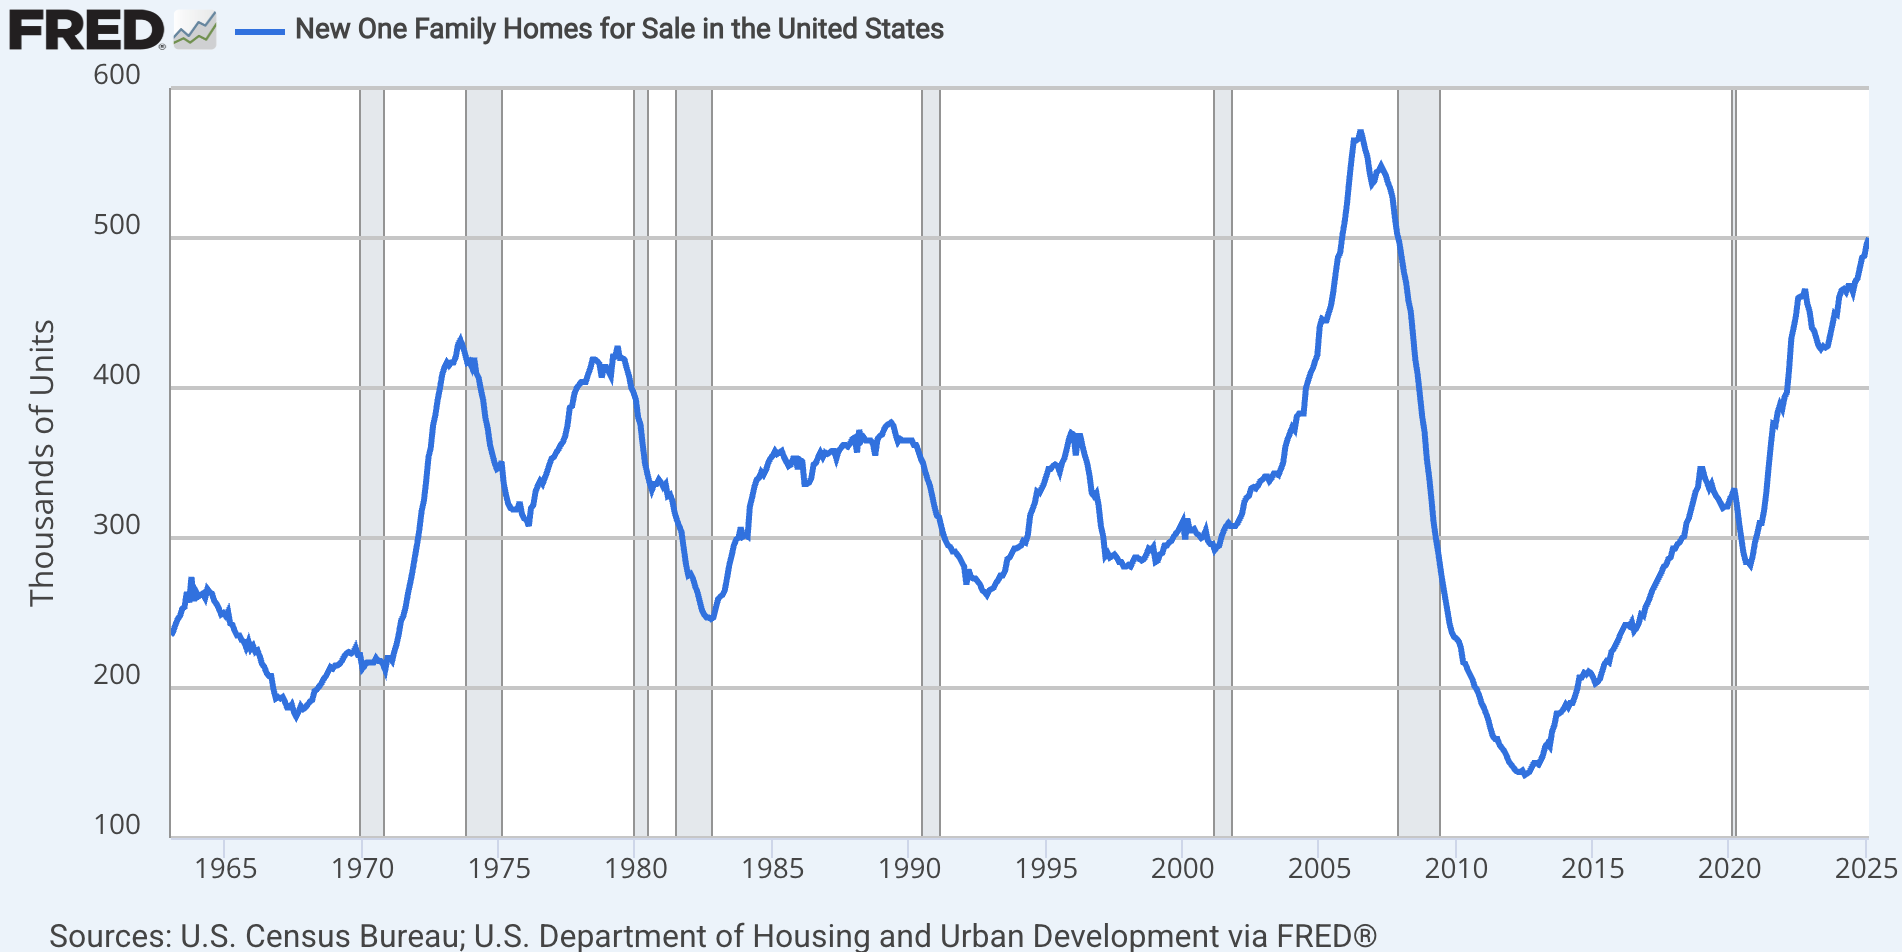
Housing supply is a good recession indicator, often plateauing before recessions
From 2003 to 2007, increased demand for housing lead to more construction in new one-family homes
But increase in supply was not enough to meet demand and stabilize home prices
Financial Crisis
Mortgage Debt
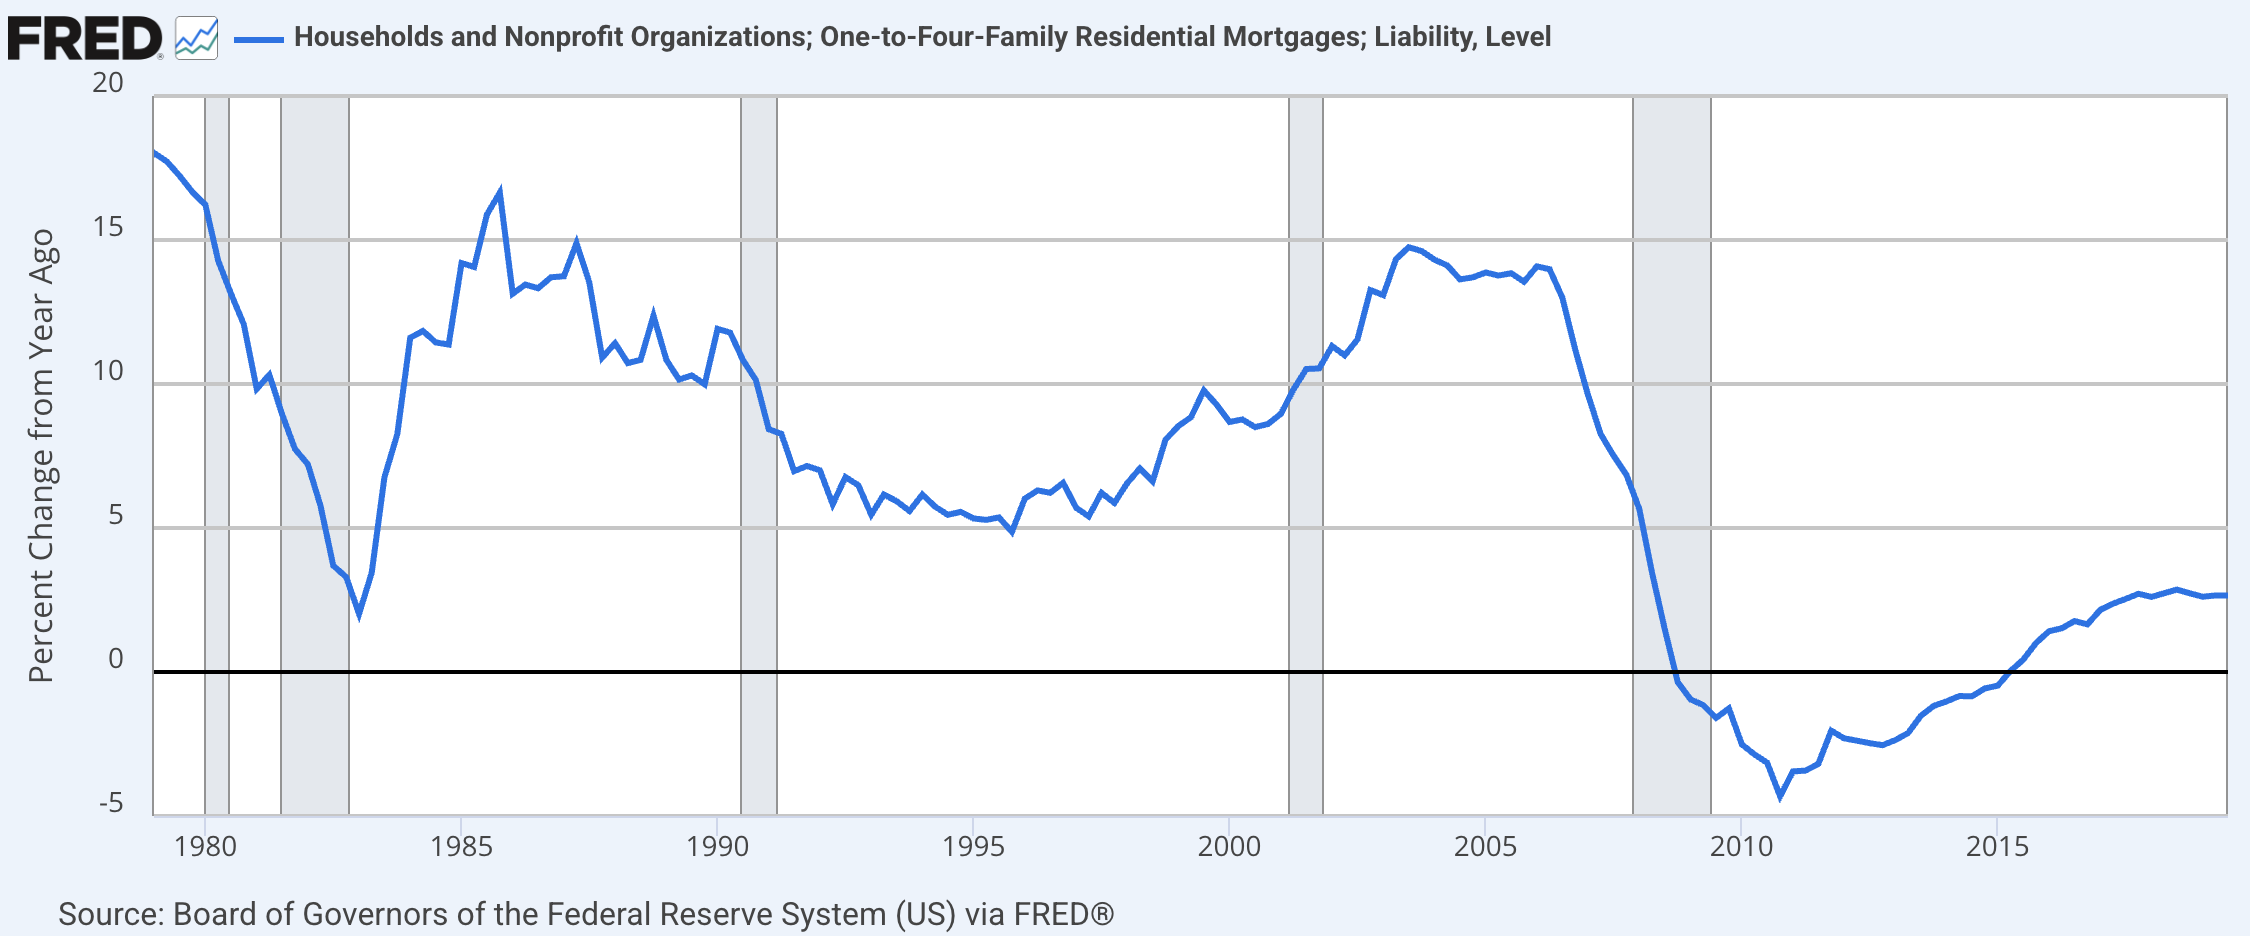
Rise in house prices accompanied by growing indebtedness of households
Mortgage indebtedness grows by 2-3 times as much in the 2000s than the 1990s
Mortgage Backed Securities
U.S. traditional lending model: local banks make loans to families in community
loan risk stays at that bank
local bank has best information about neighborhood/family
local bank would not want to loan to family unable to pay them back
Securitization: Mortgage Backed Securities (MBS) bundle up individual mortgages into securities that can be bought/sold in large volumes
local bank can sell mortgages to big banks (transfer risk)
big banks diversify risk by bundling mortgages from different places
Pensions/hedge funds/other countries can invest in U.S. housing market
Expanded lending: If more people want to invest in “safe” U.S. housing, then local banks can always sell their mortgages to (i.e., unload risk onto) bigger banks who bundle them into MBS.
Subprime Mortgages
People with a credit history have a credit score, e.g., FICO or VantageScore, ranging from 300 to 850
Prime mortgages: Mortgages given to families with good credit scores (660+) pay lowest/prime interest rates
Subprime mortgages: given to families with low credit scores who are more likely to become delinquent and thus pay higher interest rates
Credit score is largely determined by
length of credit history: a long history of making payments on time means a higher credit score
amount owed: a low usage of available credit means a higher credit score
U.S. mortgage lending was very relaxed and unregulated: No Income, No Job or Assets (NINJA loans, “no-doc”, “low-doc”)
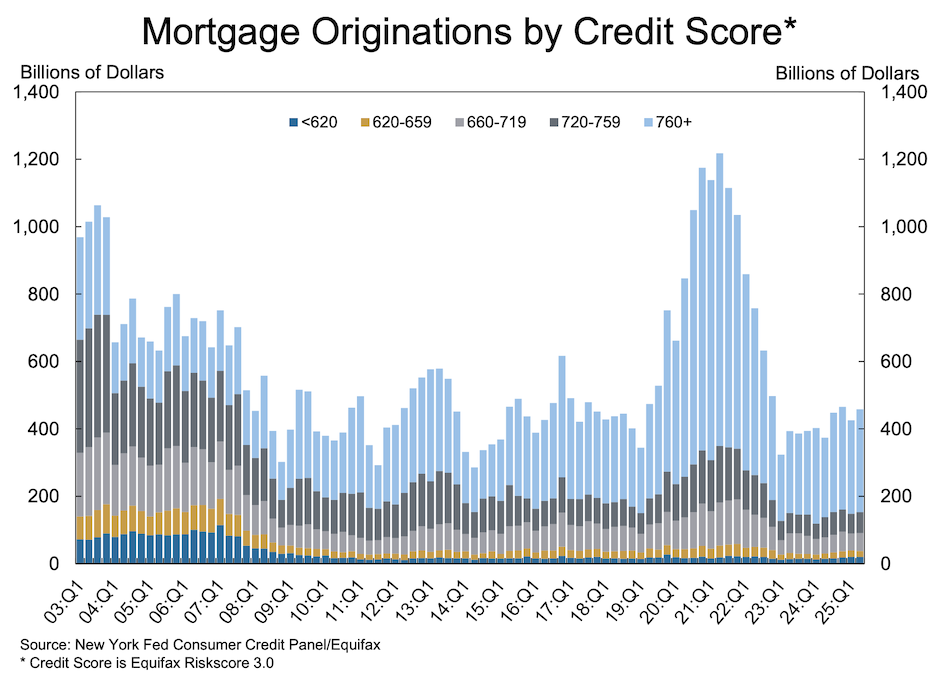
Source: NY Fed, Center for Microeconomic Data, “Household Debt and Credit Report”
2003-2007, larger share of new mortgage $ in sub-prime market
2020-2022, huge increase in new mortgage $ given expansionary monetary and fiscal policies as well as COVID-related changes in household preferences
Mortgage Delinquency
Mortgages used to buy second homes, which one study estimates is responsible for “30 and 15 percent of the run-up in construction employment and house prices, respectively, over 2000-2006” (Garcia, 2019)
Subprime mortgages were concentrated in particular cities/neighborhoods (e.g., lower income or boom regions)
Adjustable Rate Mortgages (ARMs): “teaser” rates that reset after 2, 3, or 5 years to the market rate
people were surprised by very high mortgage payments (e.g., prime rates from in 2002-04 to by 2006-07)Underwater: mortgage owed exceeds value of house
walk away and foreclose (bank sells) the home
home prices fall furtherAll of these factors contributed to growing mortgage delinquency.
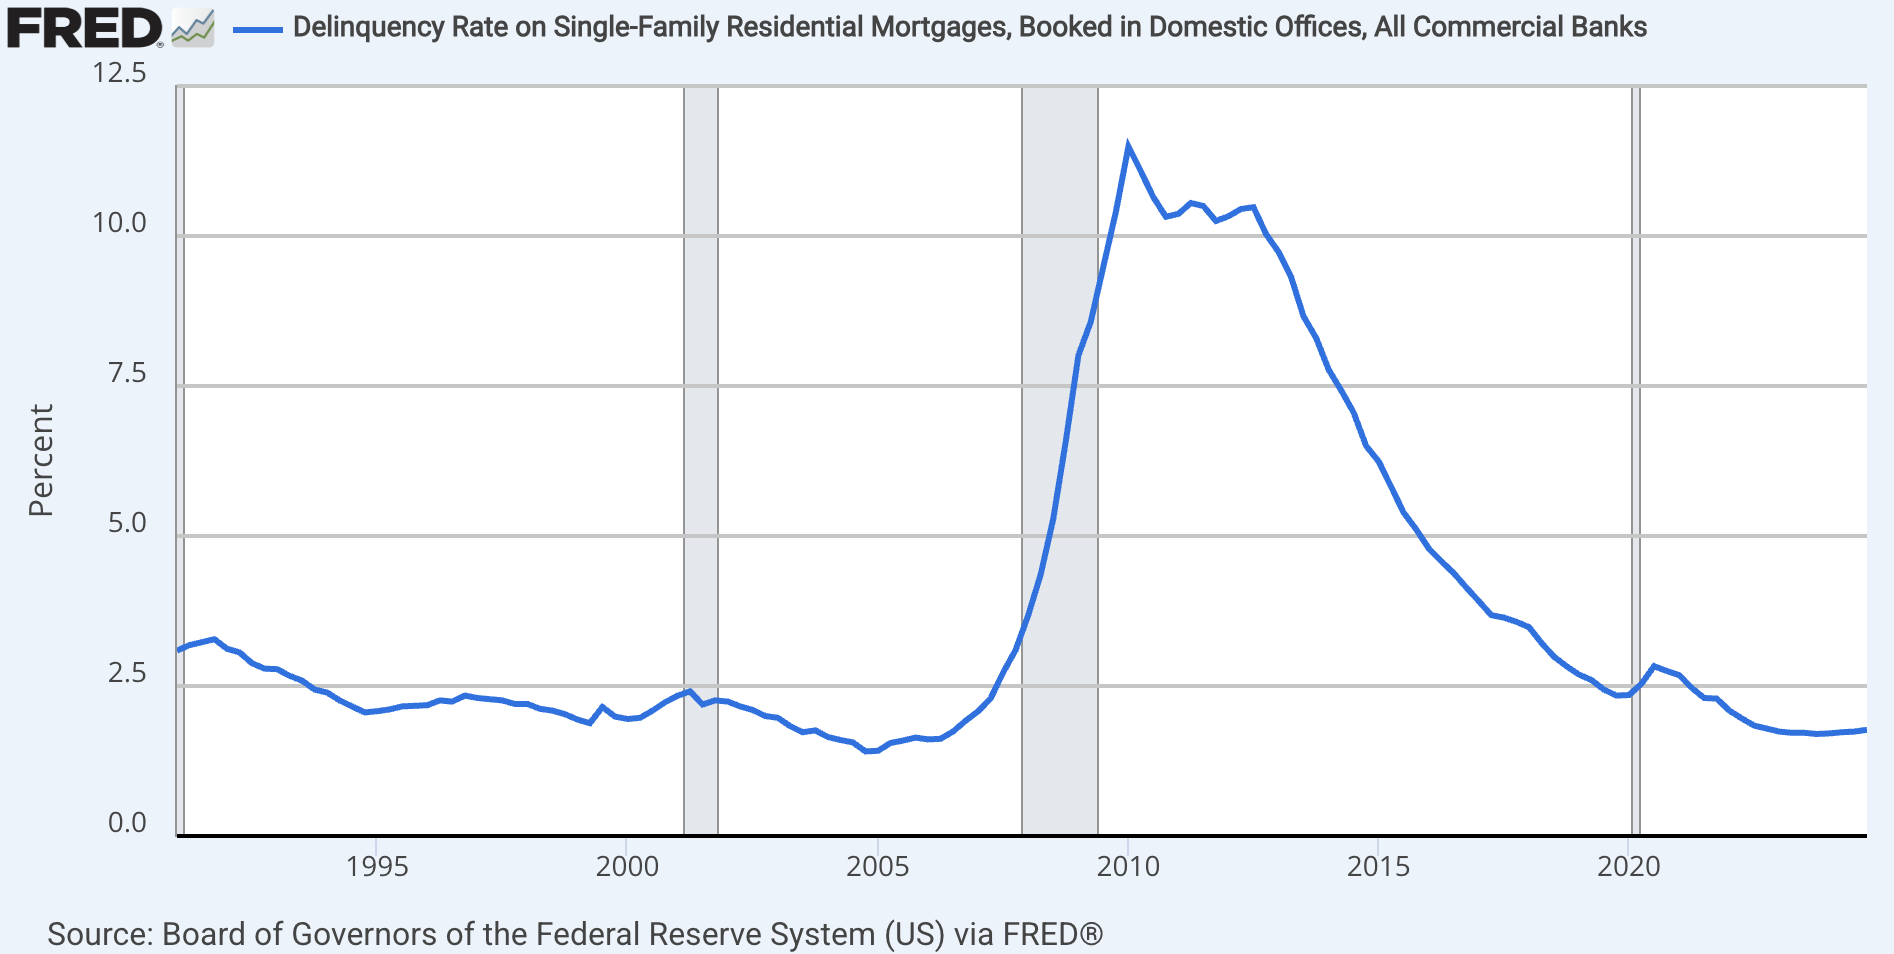
Delinquent loans are those past due thirty days or more
Pre-crisis delinquency rate on mortgages was 2.5%
After the housing bubble popped, about 1 in 10 mortgages became delinquent
Mortgage payment forbearance and foreclosure moratoriums did not exist during the financial crisis as they did during COVID.
Financial Innovations
MBS are only one financial innovation that played a role in the crisis. There are also:
Collateralized Debt Obligations (CDO): securities that cater to an investor’s preference for risk, i.e., risk-free vs. risky, whose value comes from other securities, e.g., MBS
lets different kinds of investors participate in U.S. housing, further driving demand for more mortgages
“complex”: CDO value is derived from underlying MBS whose value is derived from underlying mortgages
Credit Default Swap (CDS): uncollateralized “insurance” where seller of the CDS, e.g., AIG, compensates the buyer in the event of default, e.g., Lehman Brothers
Structured Investment Vehicles (SIV): a way for banks to avoid financial regulation, increase leverage, and purchase risky securities
Rating agencies had difficulty assessing the value of complex financial derivatives and received fees from the same banks they must issue ratings for, which provides an incentive to give higher ratings
Great Recession
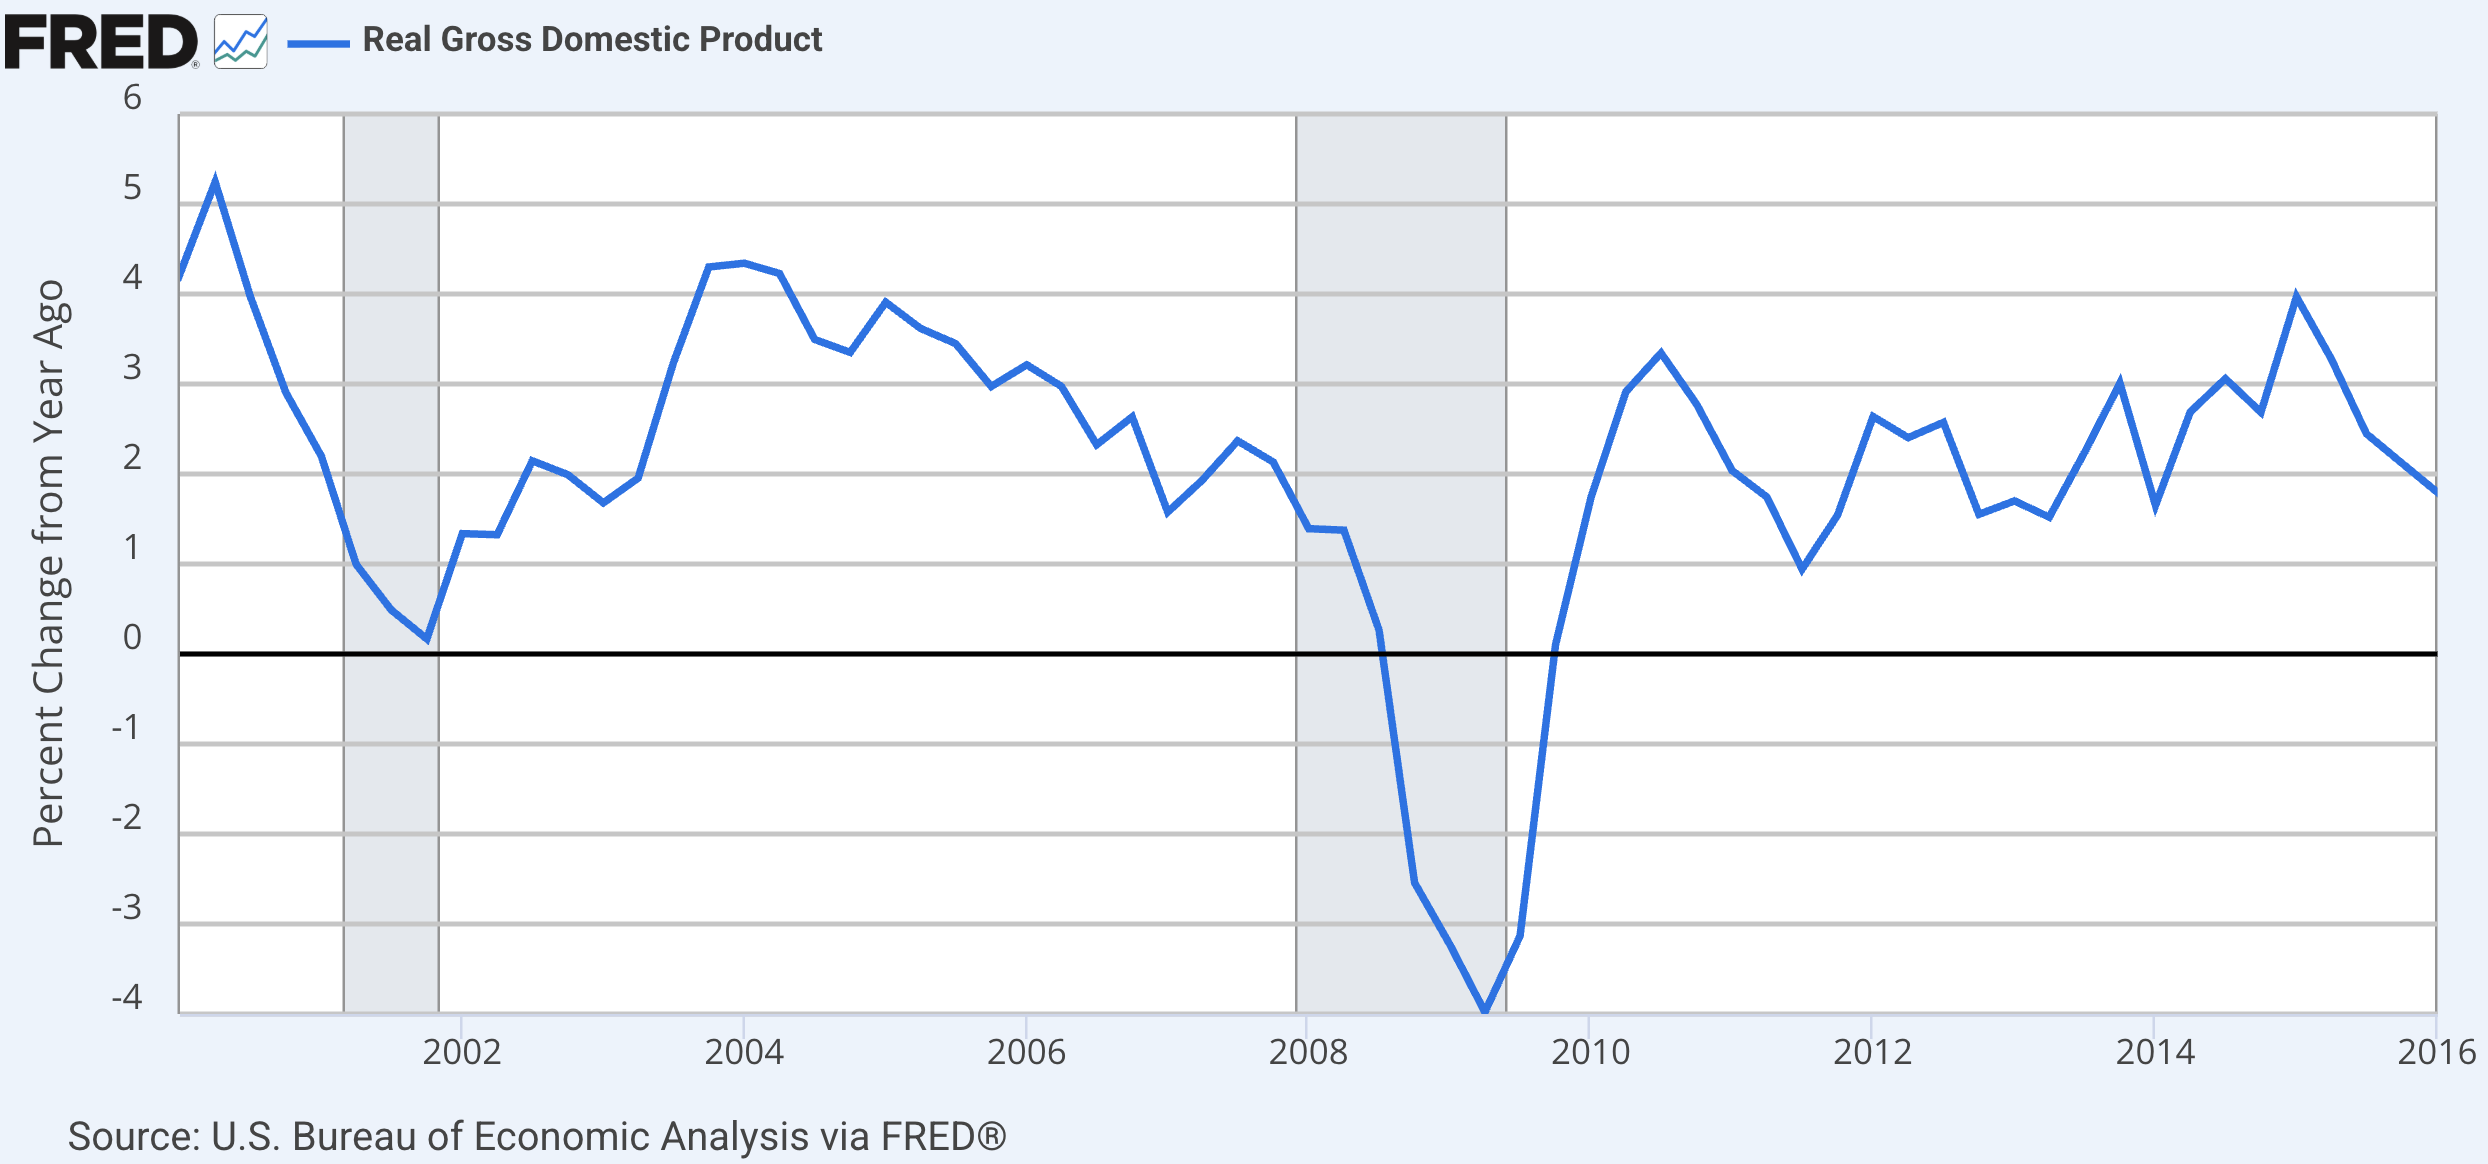
At trough of recession, real GDP growth was -4%
In 2010, growth recovered to pre-crisis rates
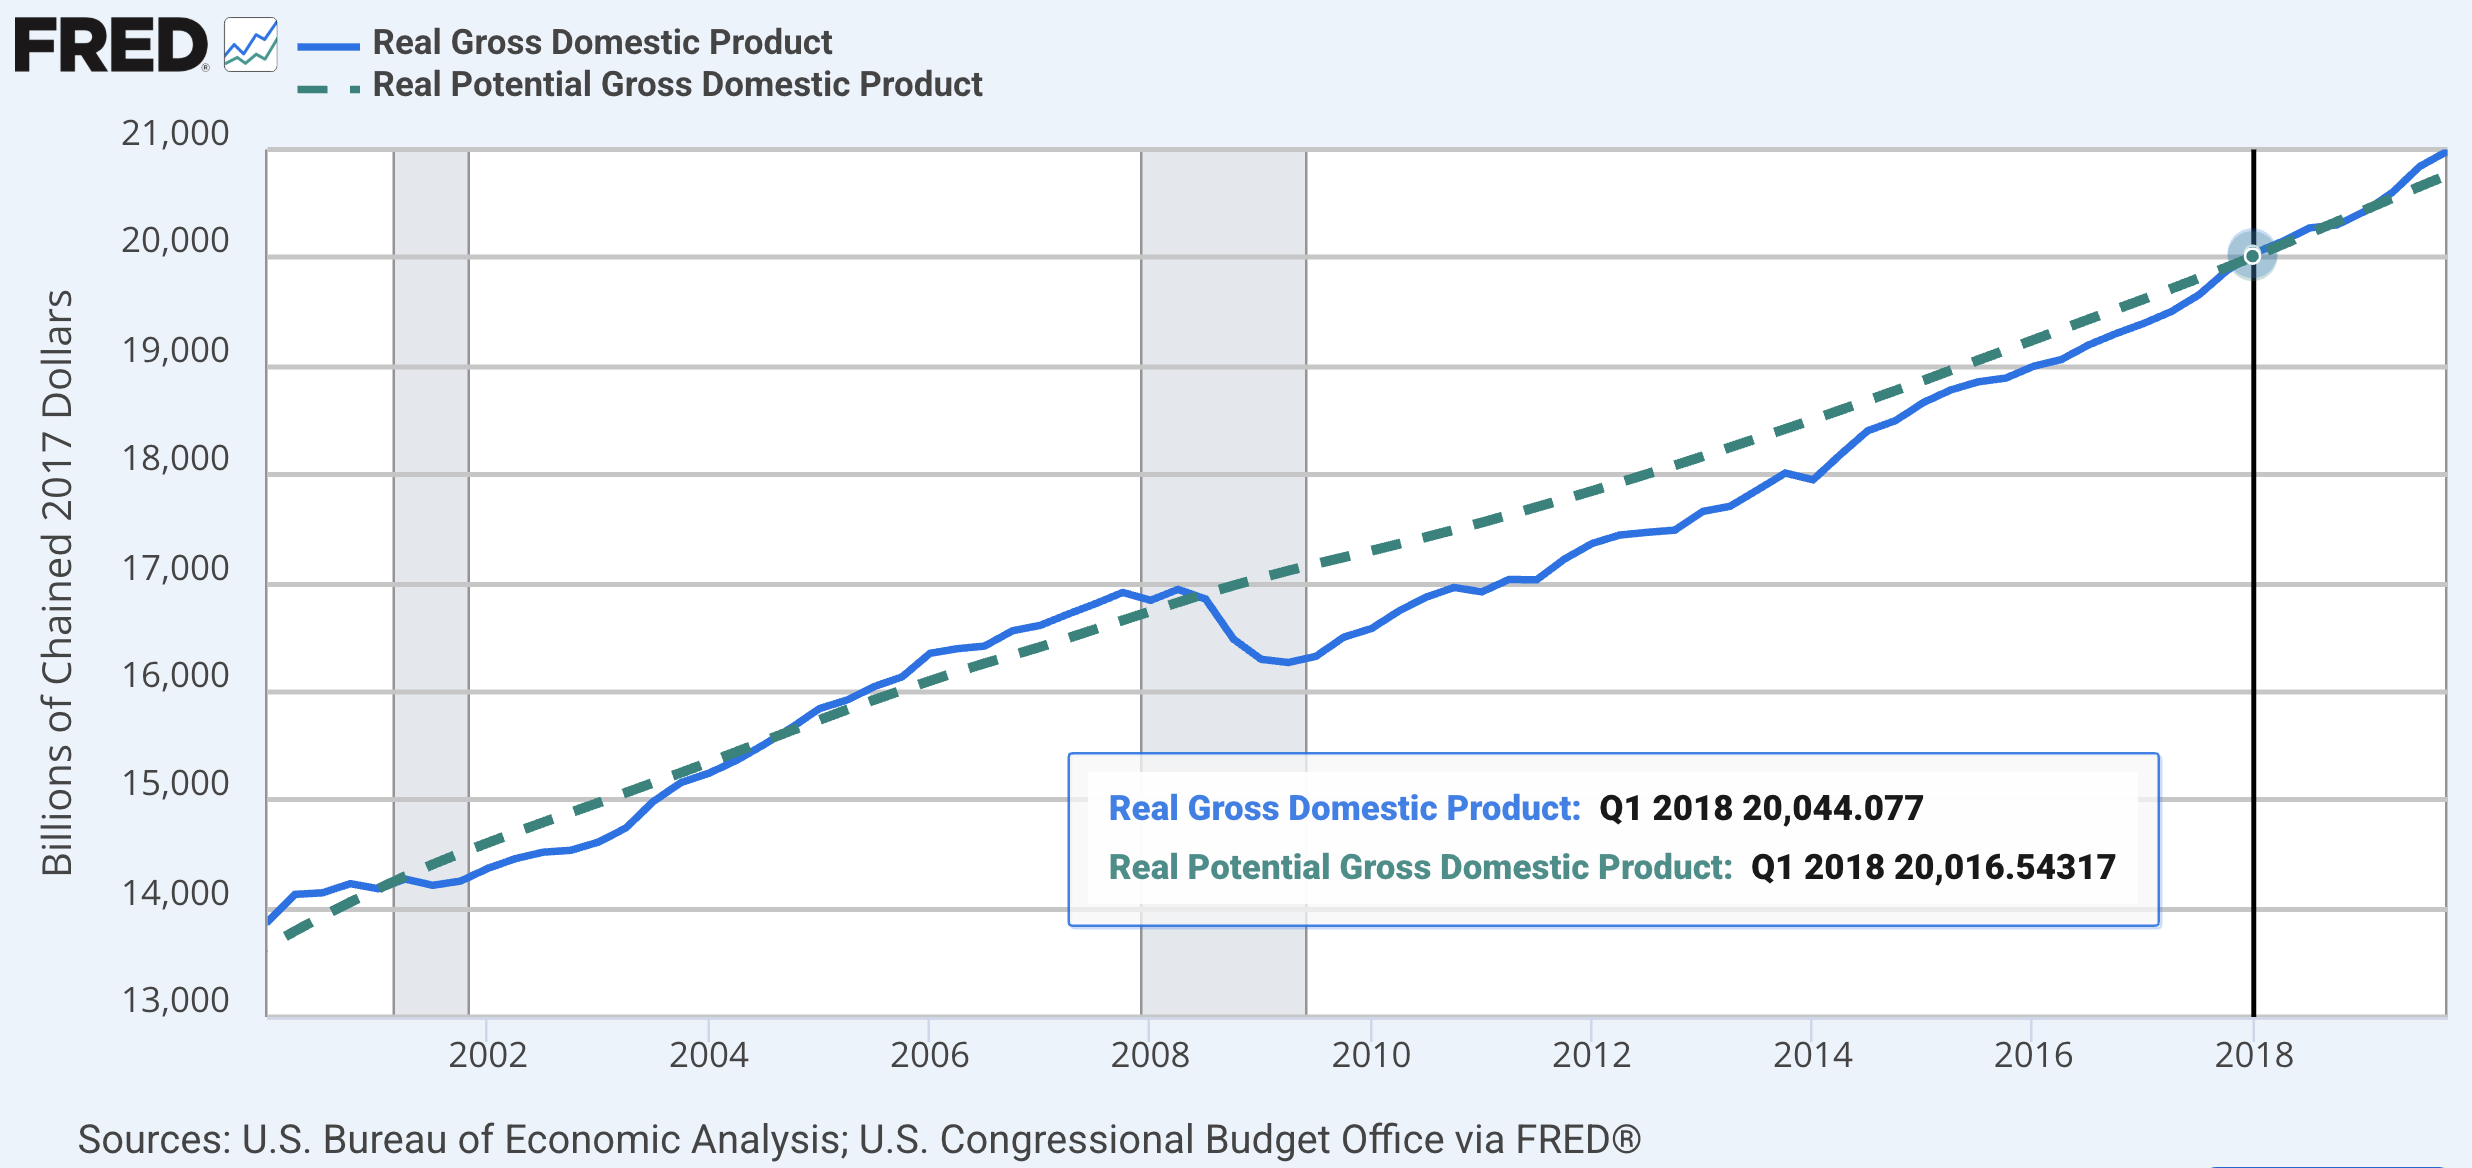
Recession pushed real GDP below potential
Full recovery of aggregate income took 9 years
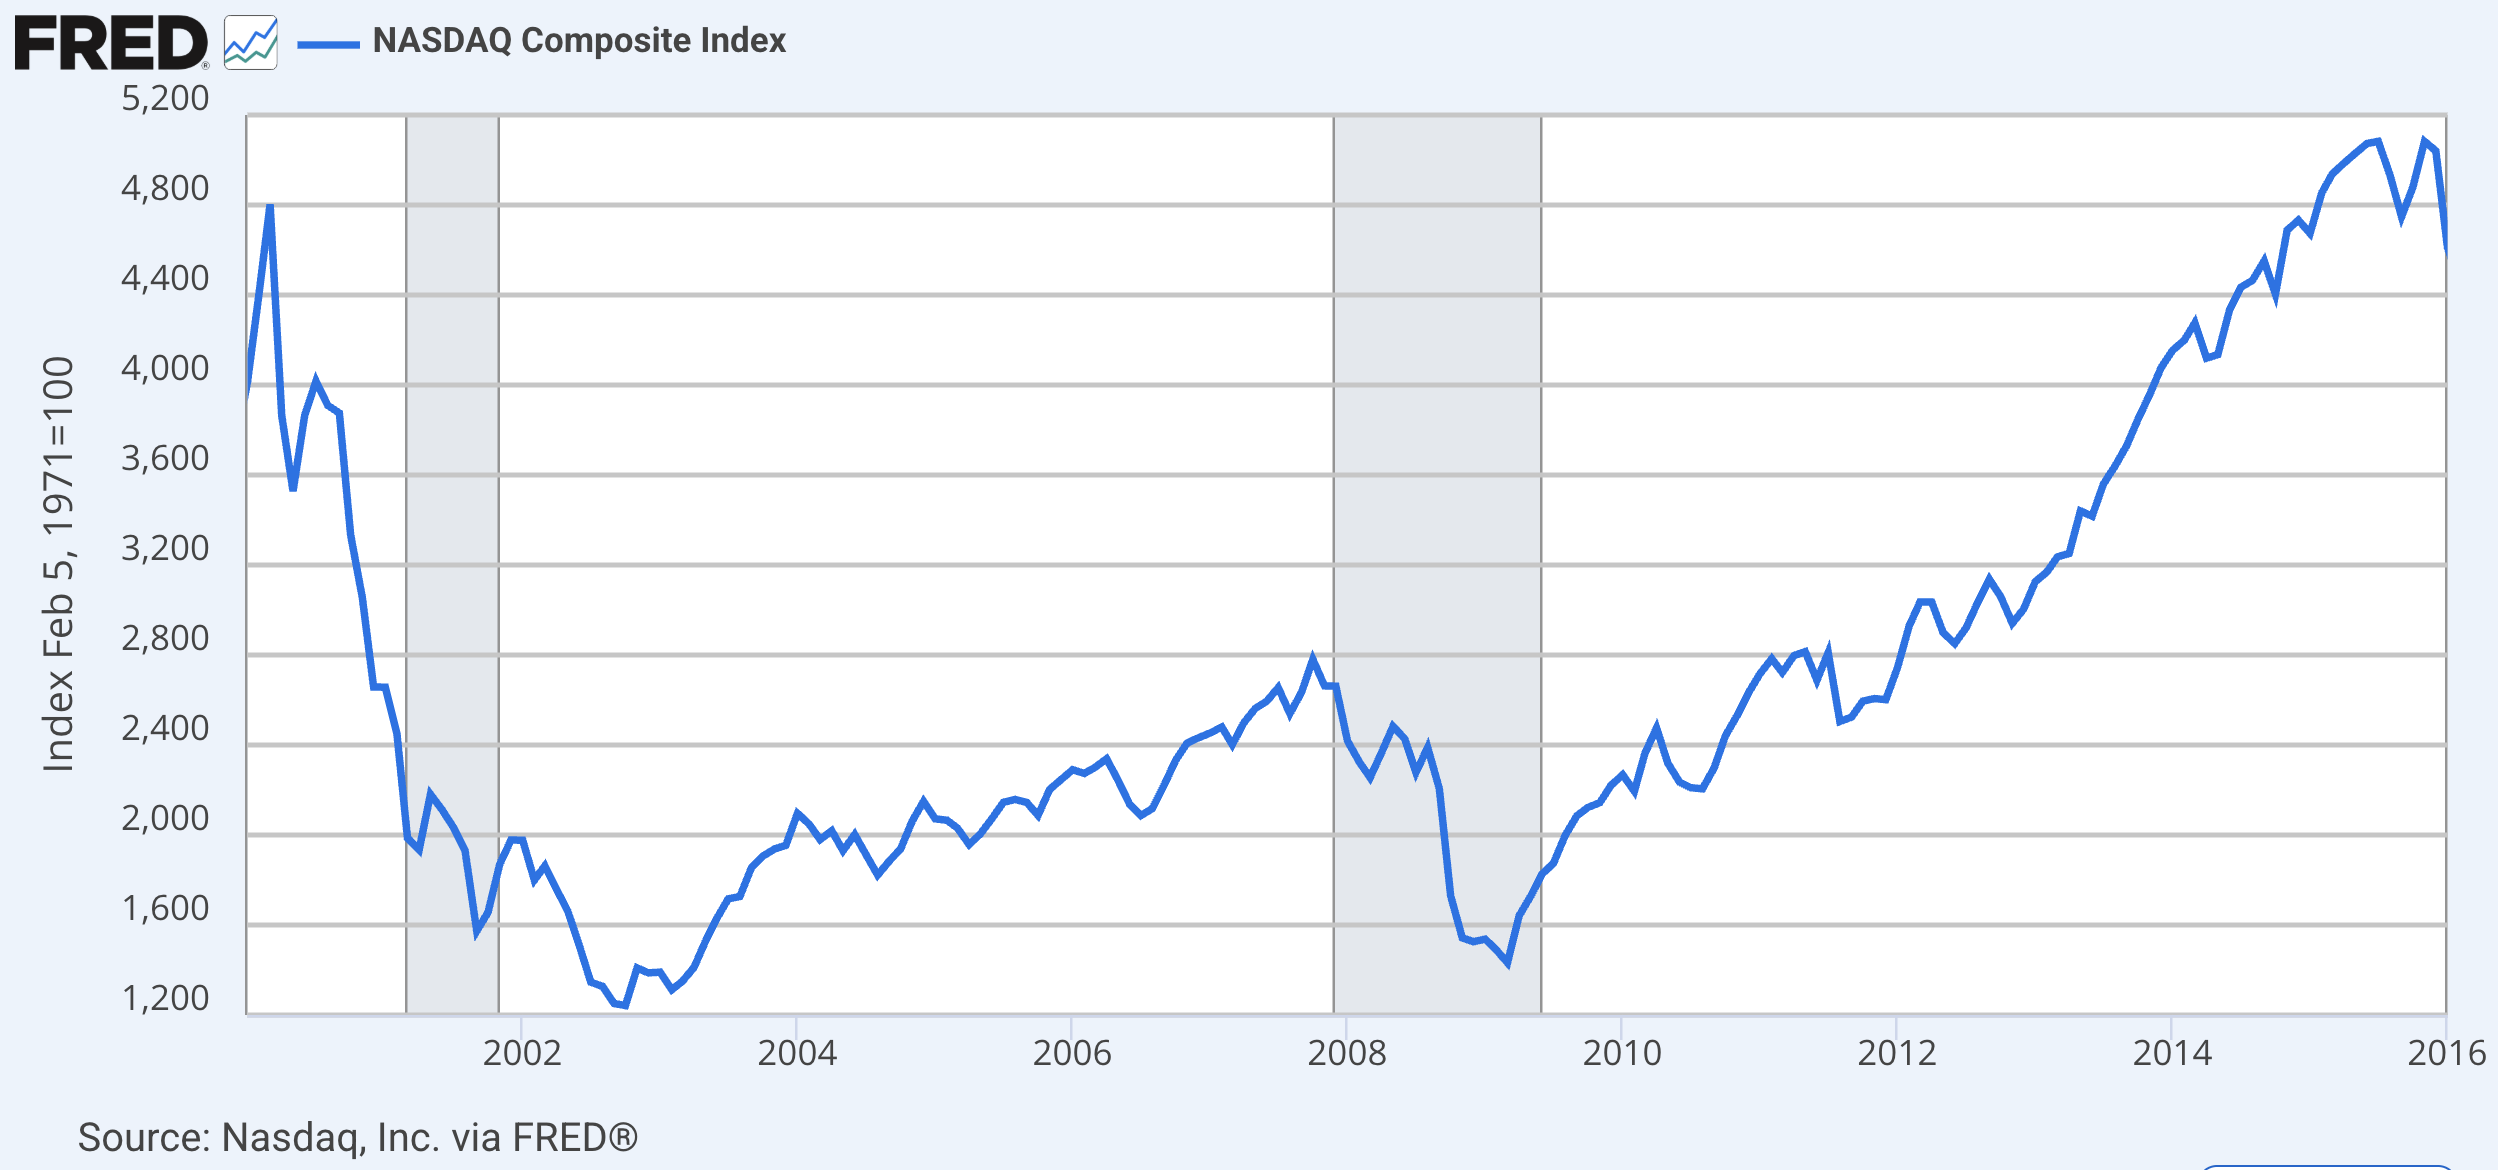
Financial crisis led to 50% reduction in NASDAQ Composite Index
Stock market did not fully recover until 2011, about 2 years after trough
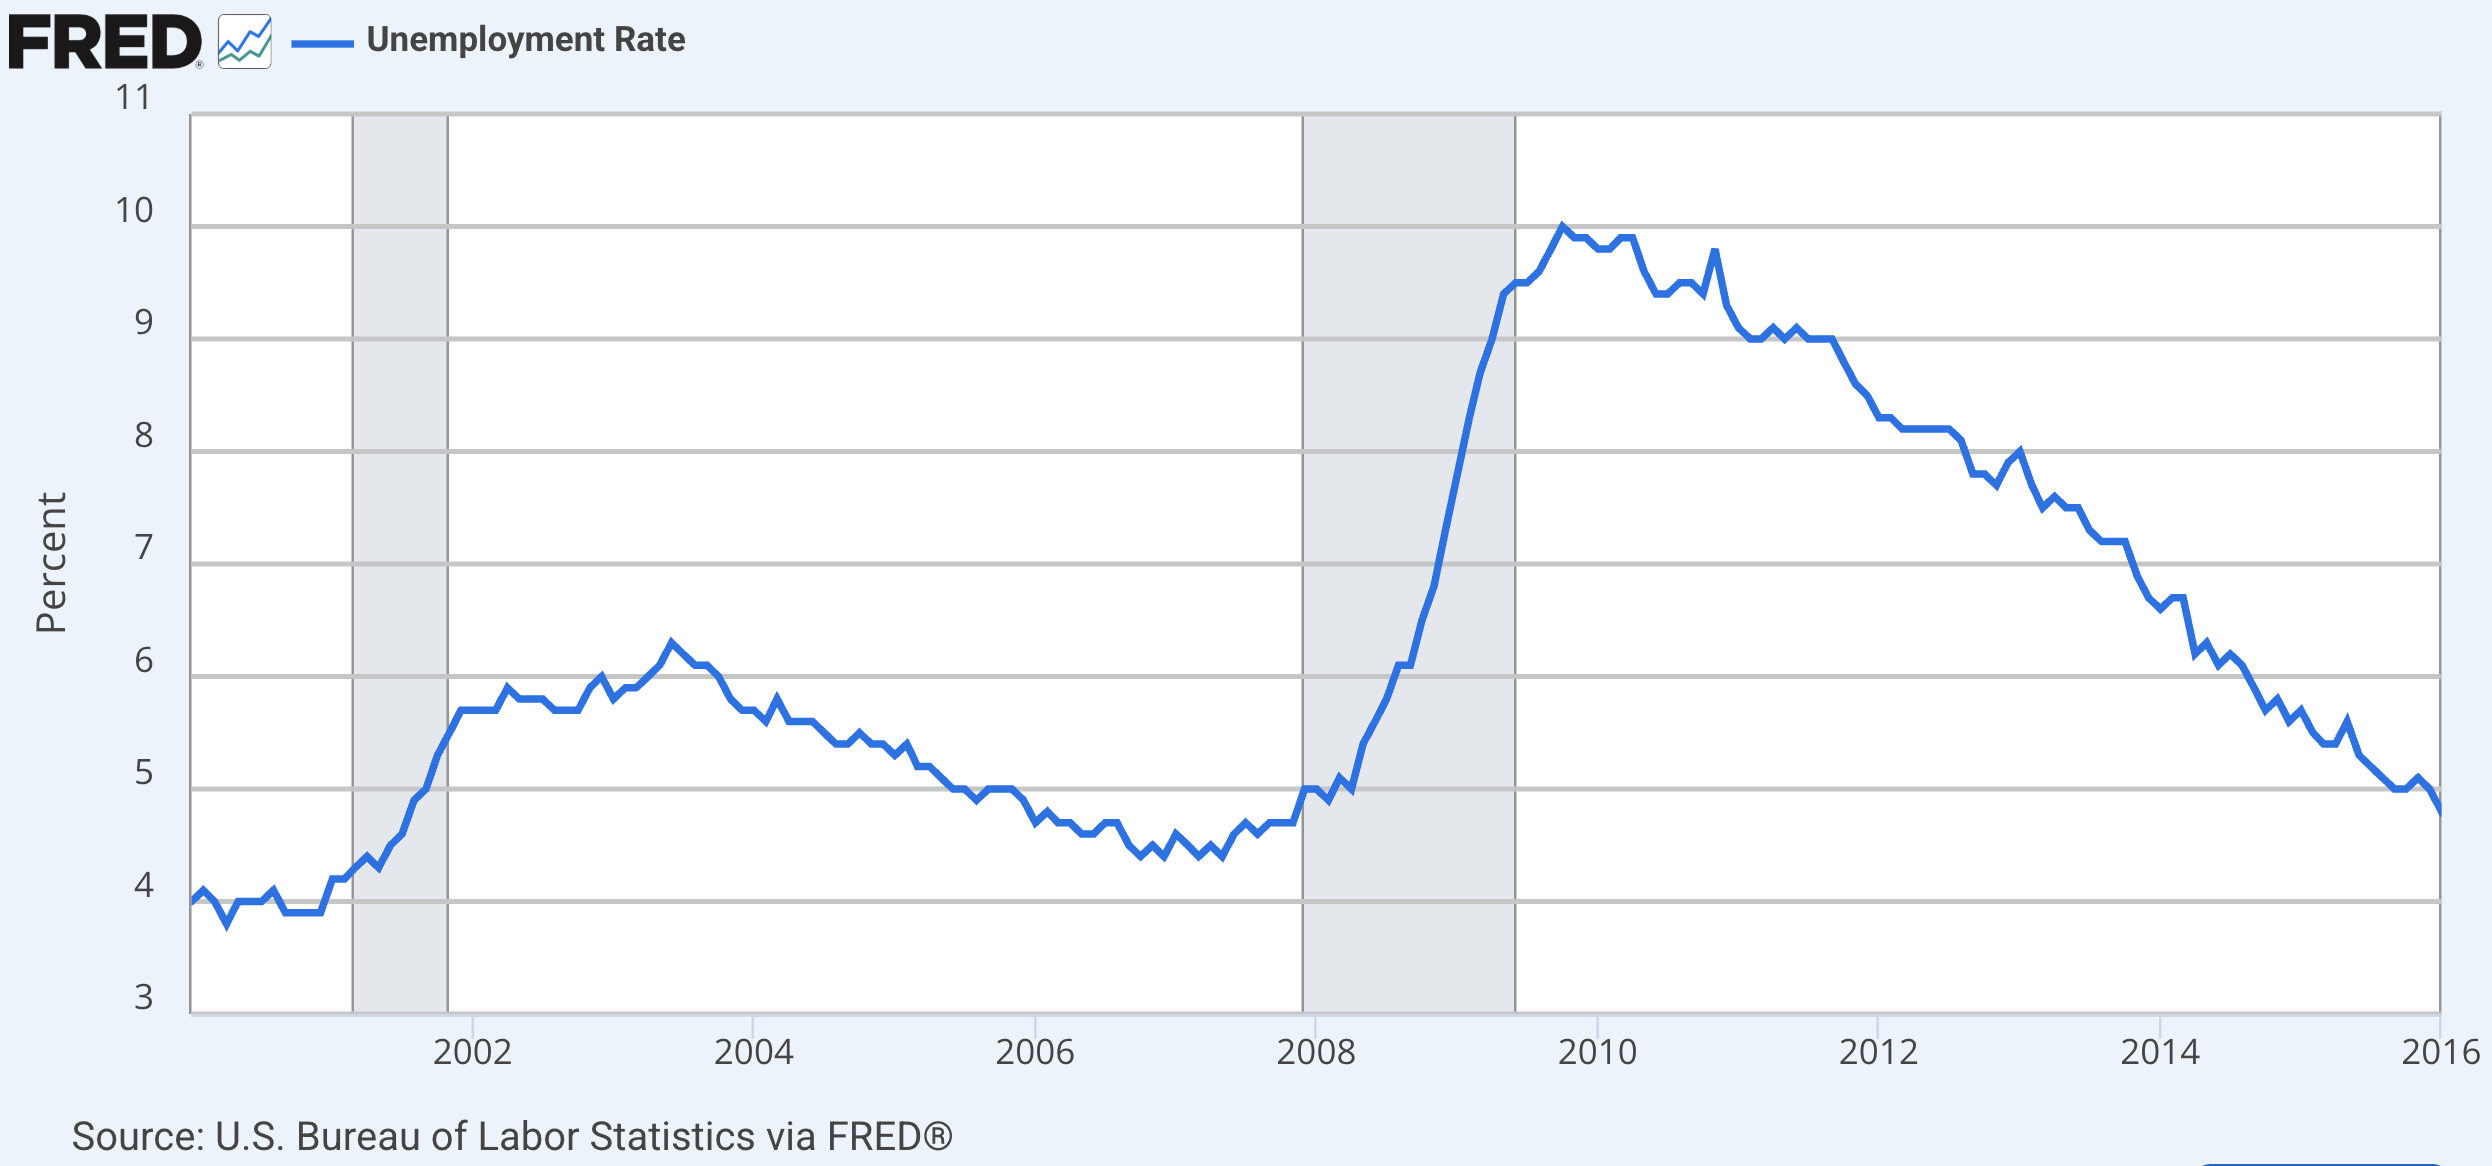
UR doubled in the recession, about 7.5M people lost jobs
It did not fully recover until 2016, about 8 years after the end of the recession
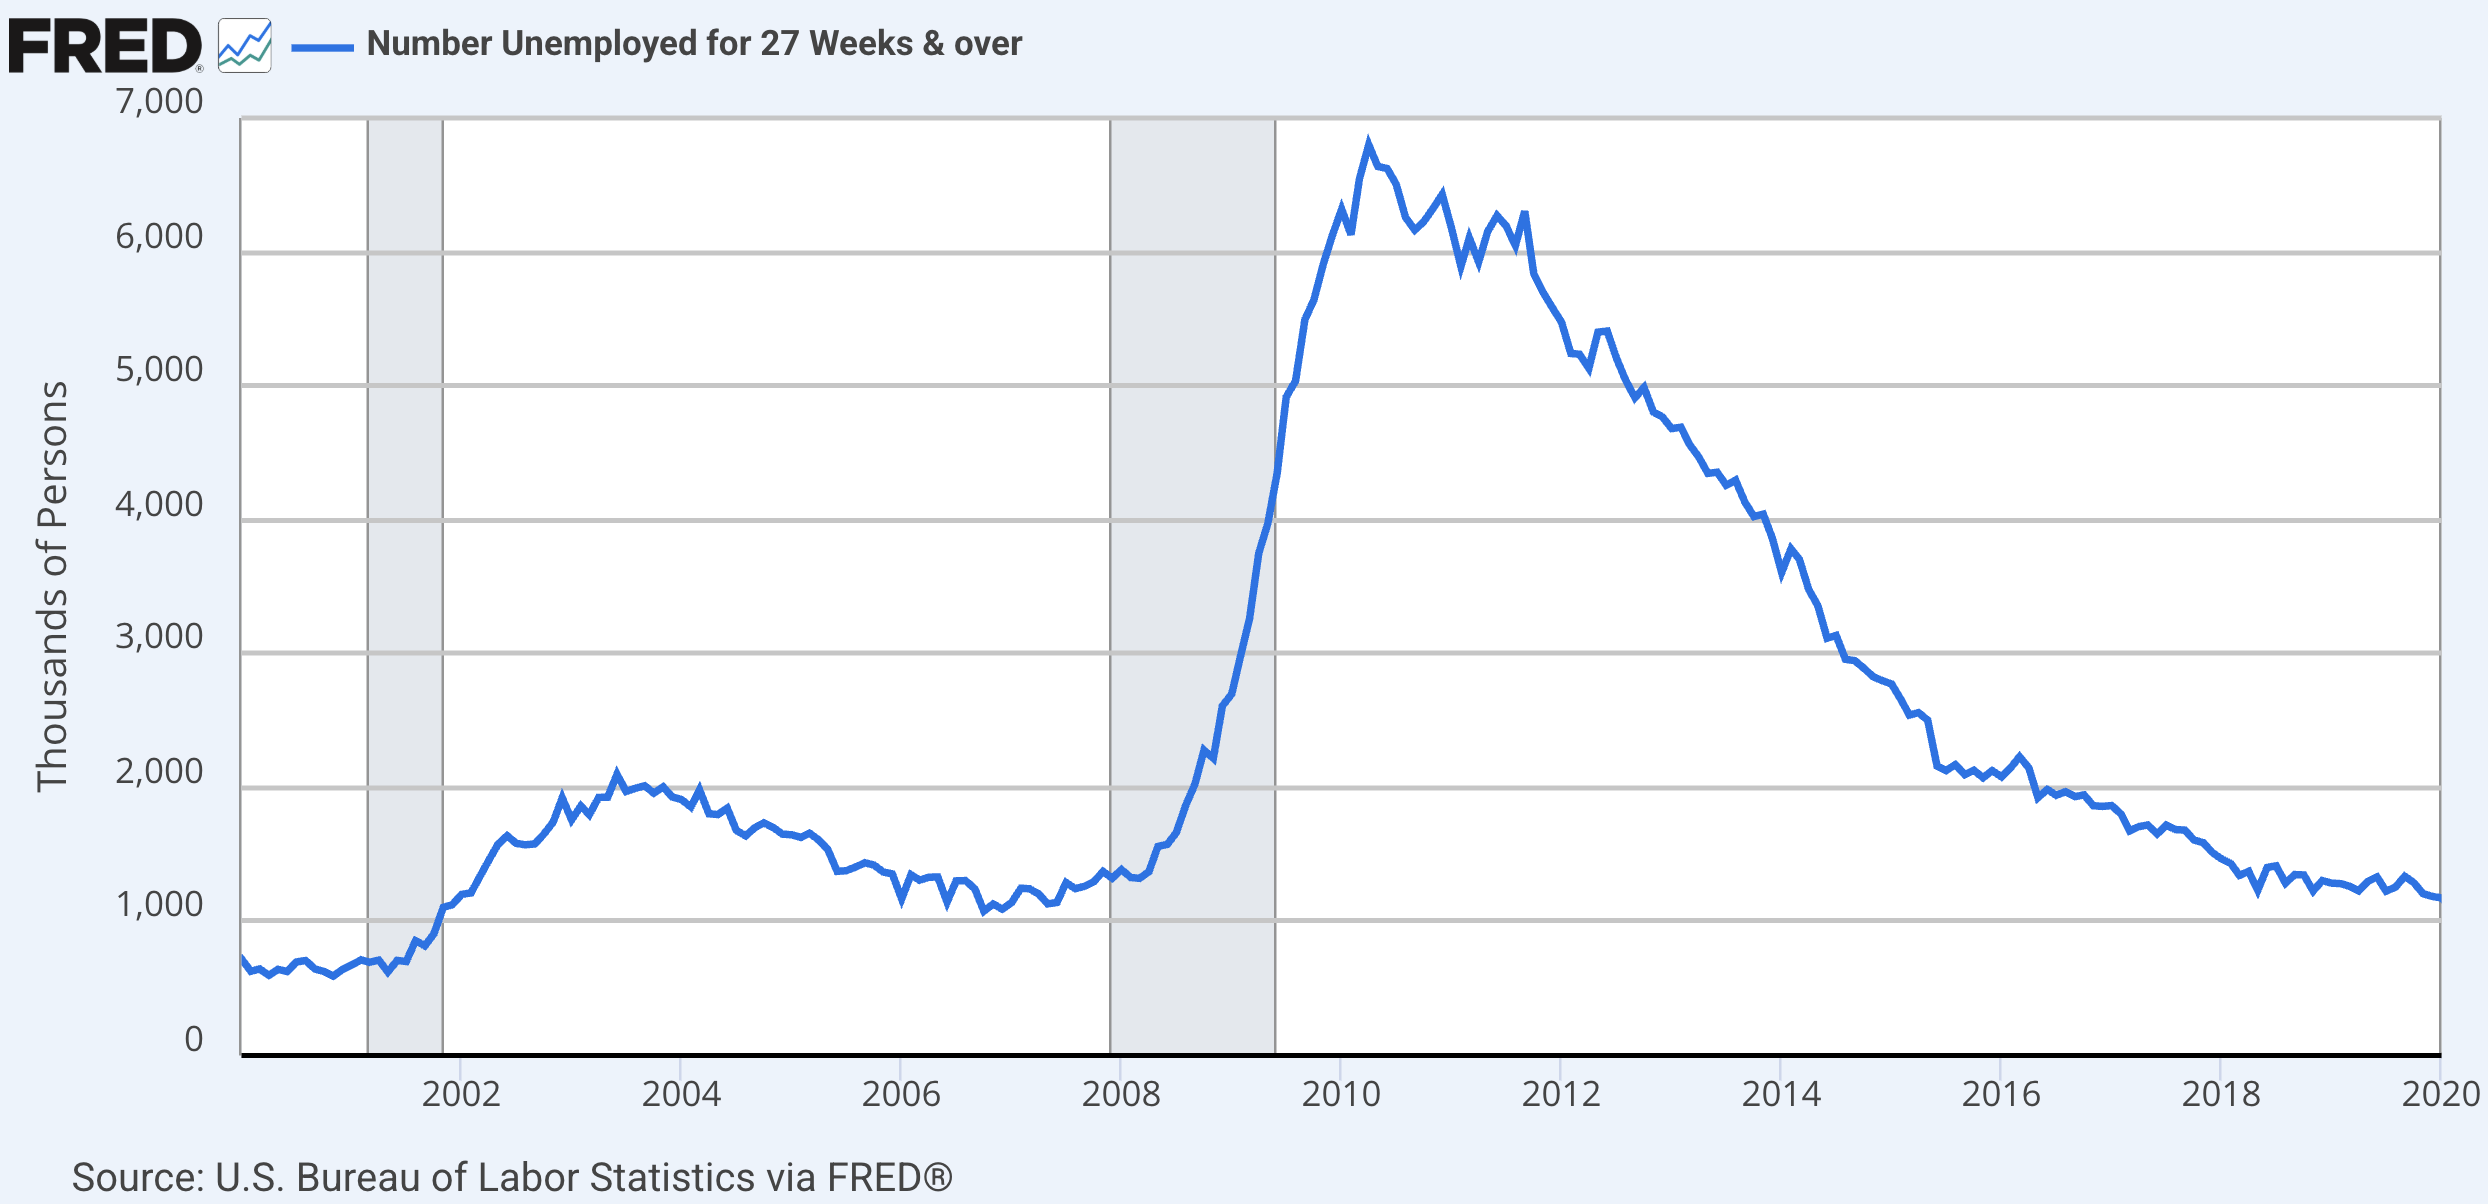
Unemployment for longer than 27 weeks persisted
It took even longer than UR to reach pre-crisis levels
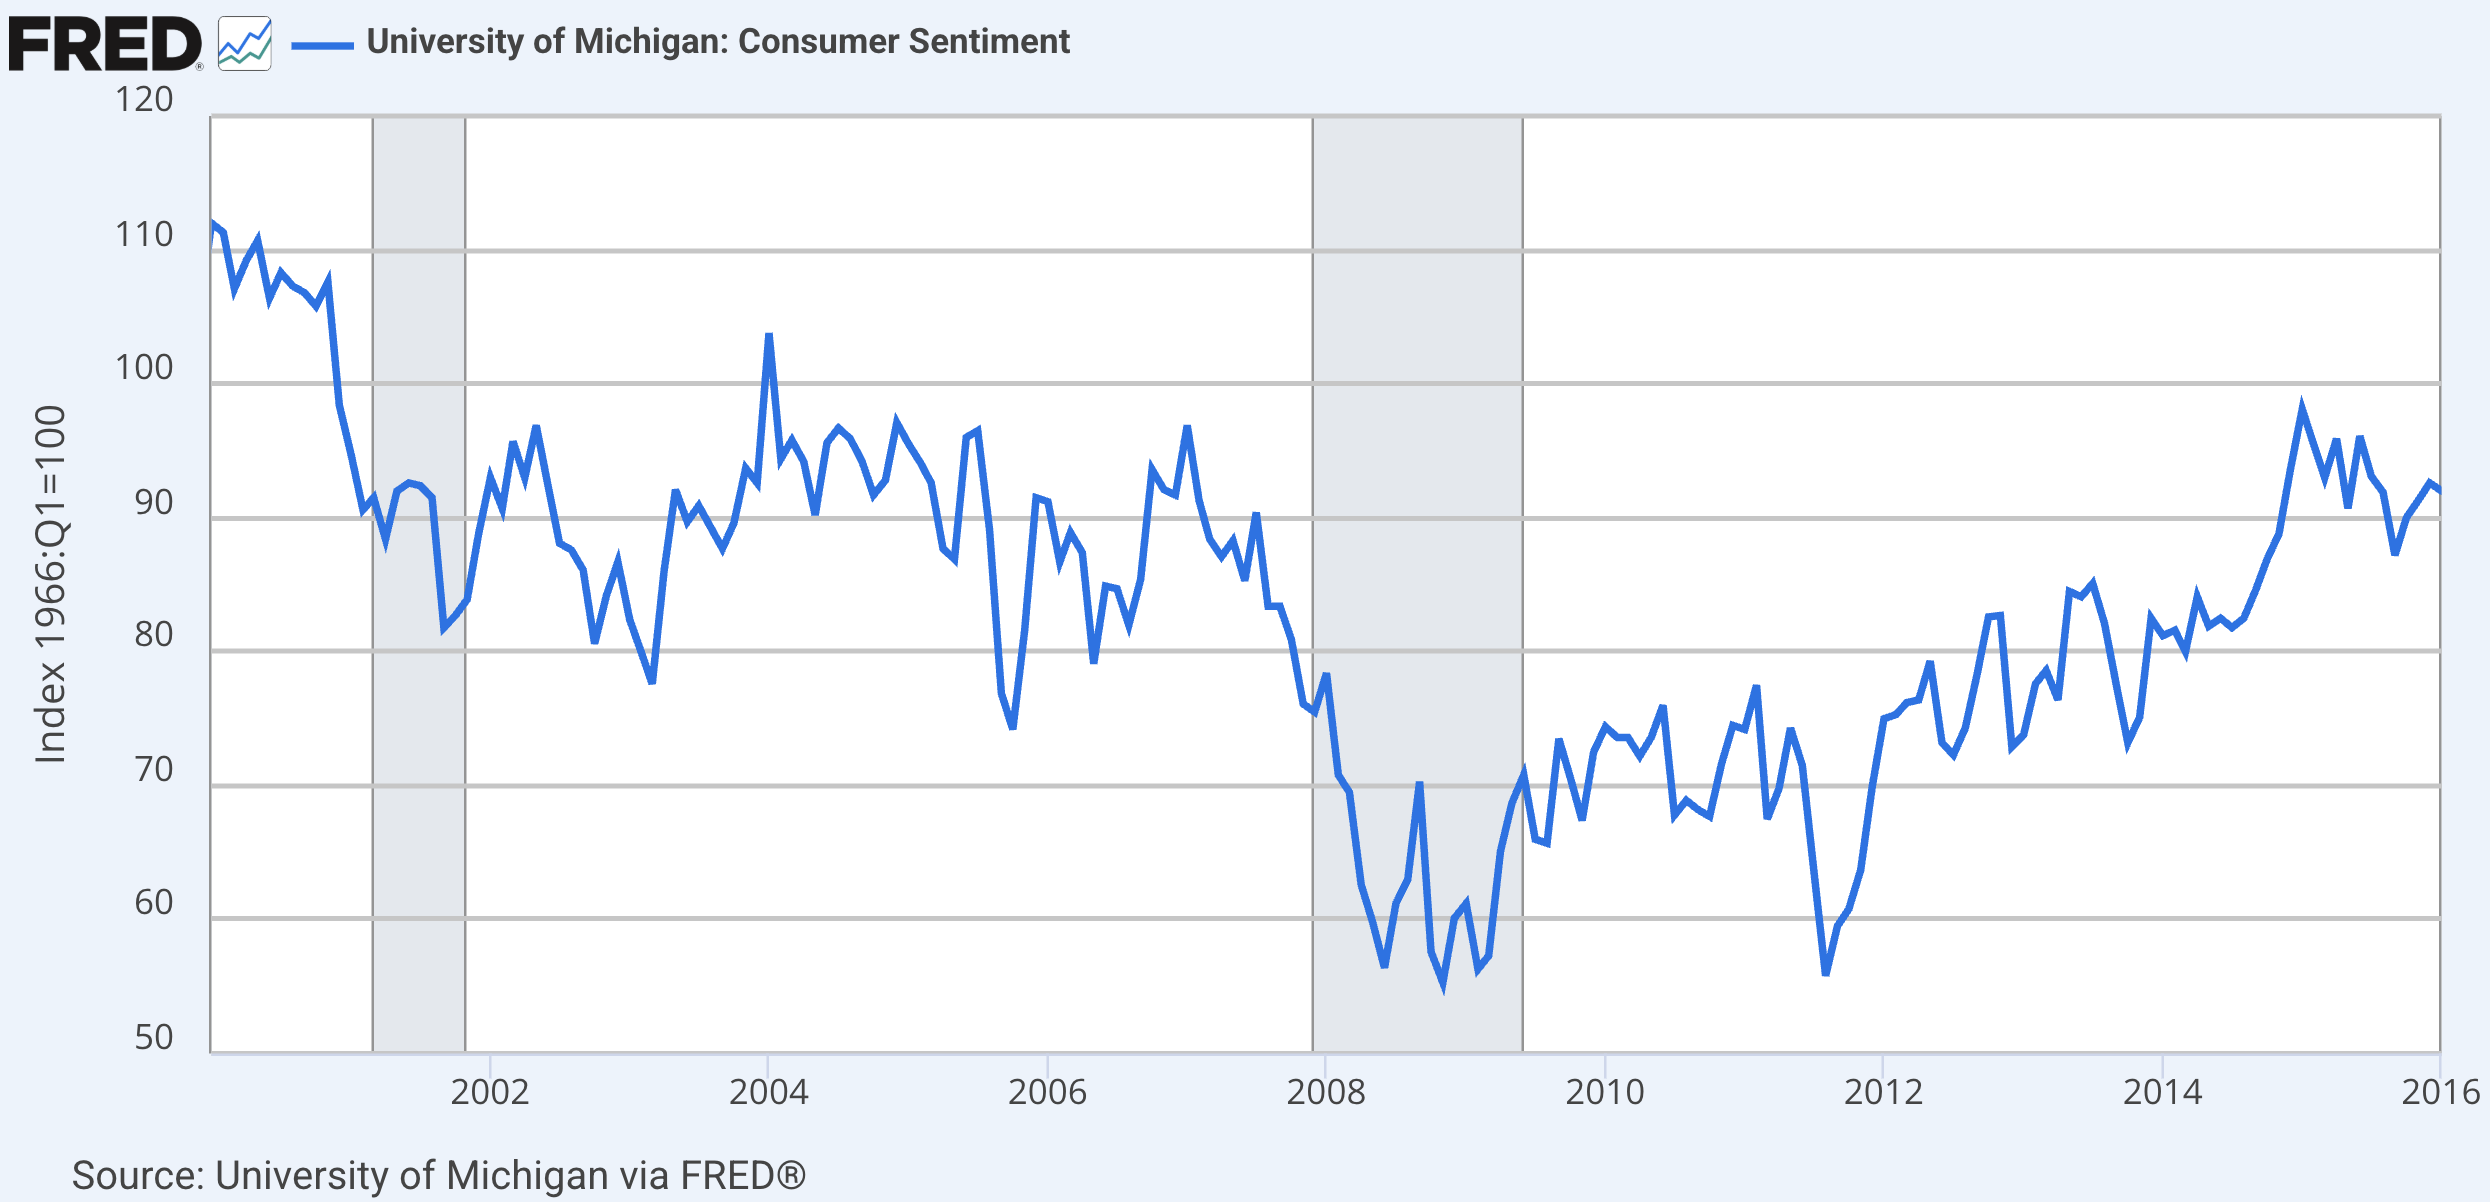
The consumer sentiment index fell from 90 to 60 during the recession
It recovered by 2015, just before the labor market
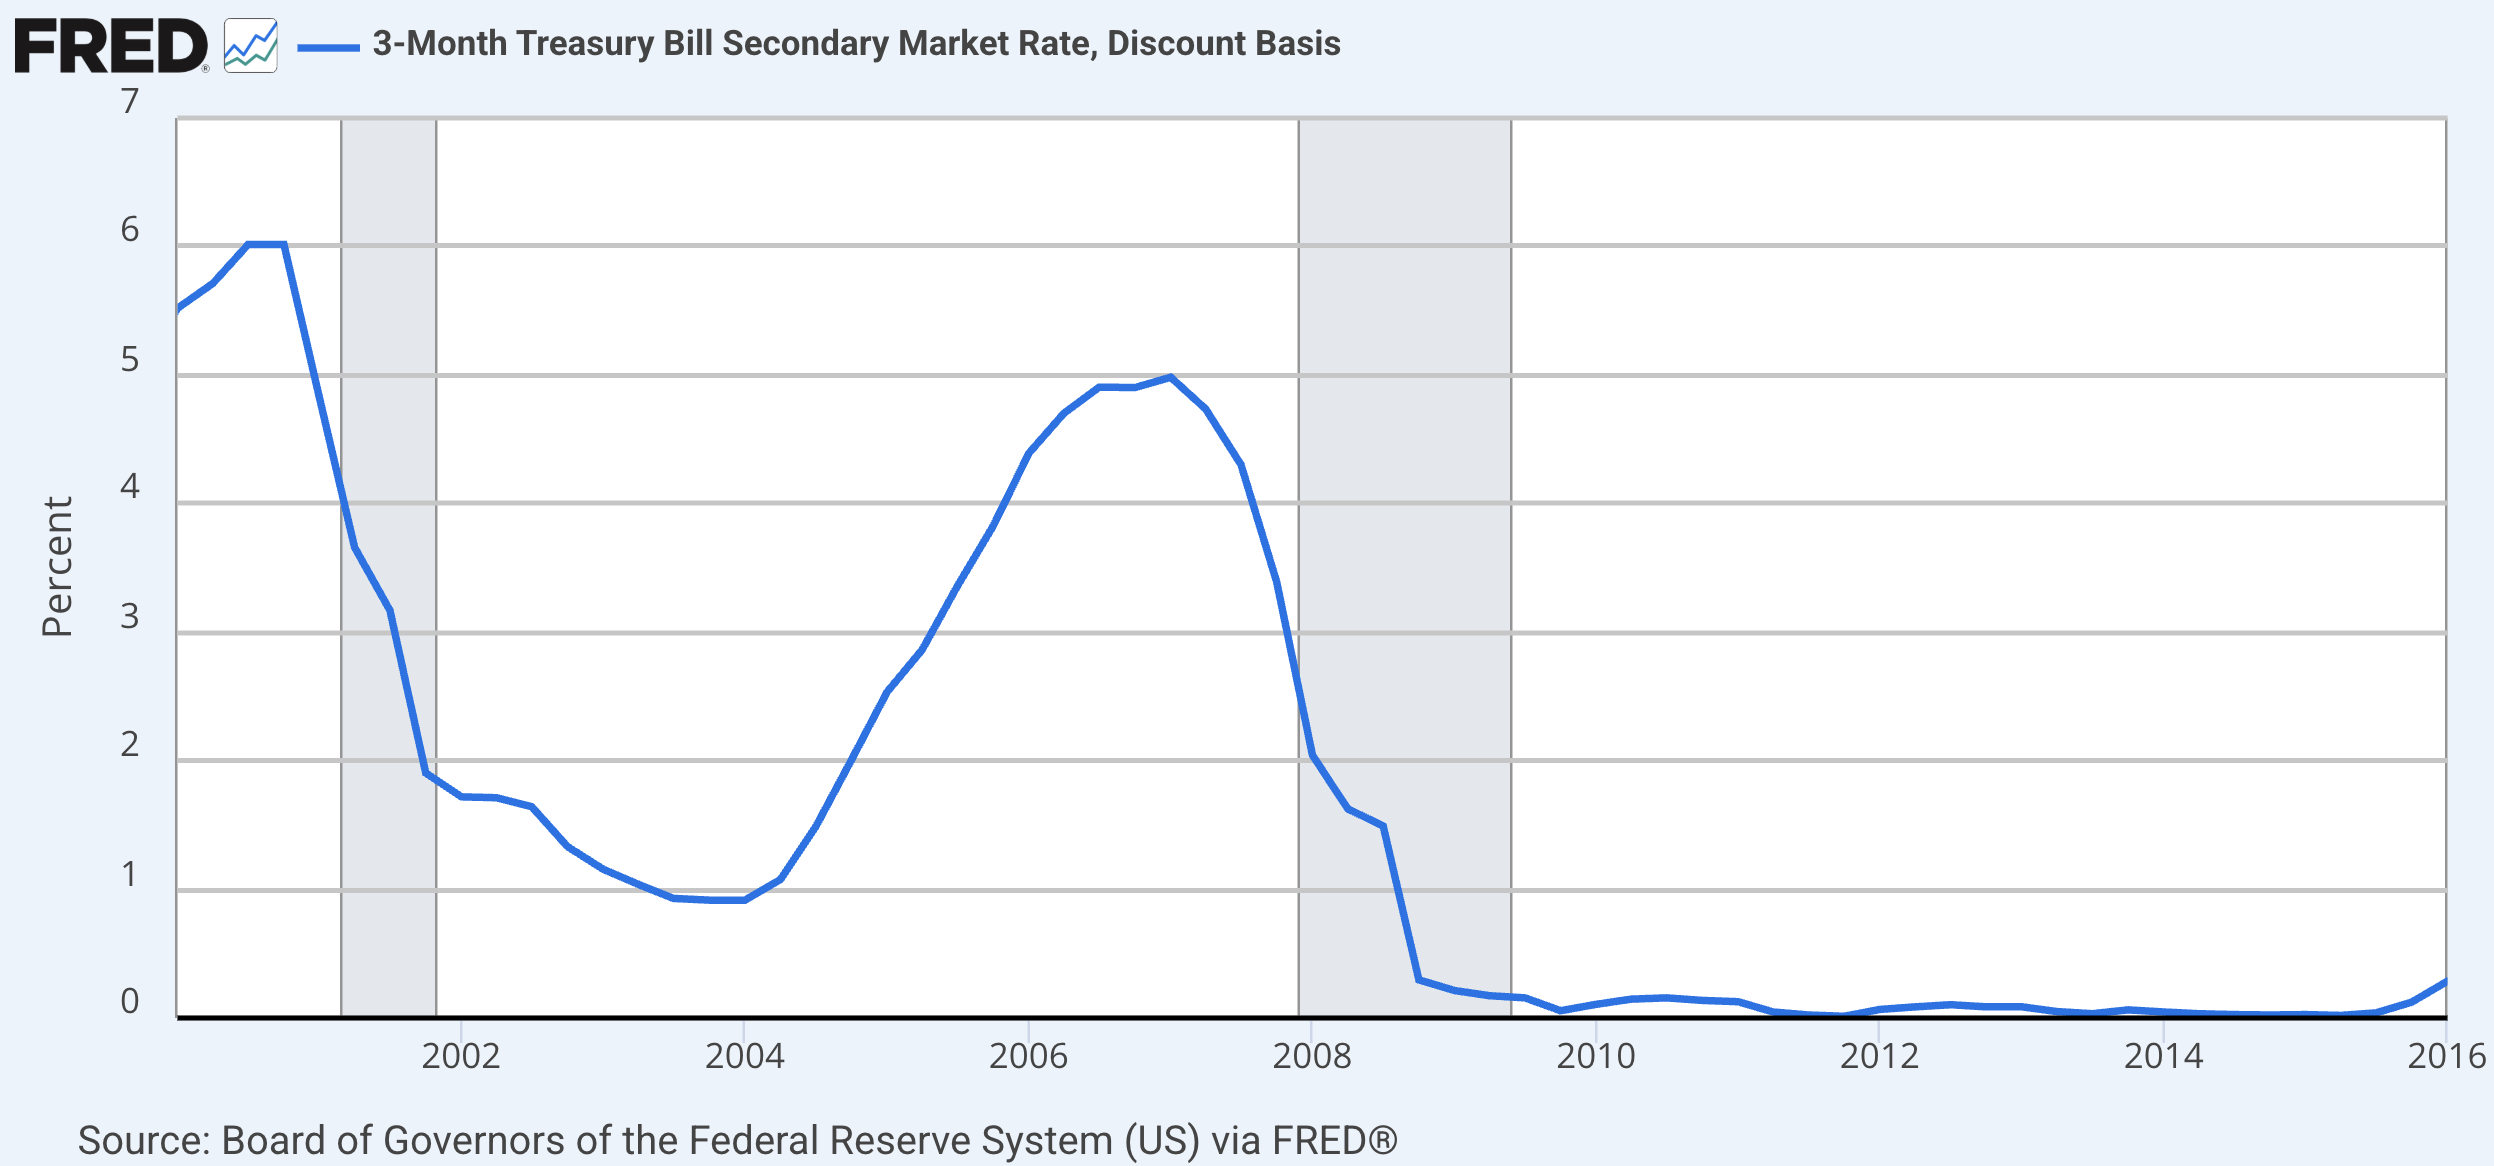
In 2008, the Fed lower short-term interest rates to near 0%, i.e., the zero lower bound
At the end of 2015, the Fed began to raise rates once the economy was finally back to normal
Policy Responses
Monetary Policy: Fed sharply reduced its policy rate from to 0- (2008Q4)
Fiscal Policy: the American Recovery and Reinvestment Act of Jan 2009 increased government spending (+B) and cut taxes (-B)
Other policies
Fed’s large-scale asset purchases (LSAP or Quantitative Easing) of MBS and long-term U.S. T-Bonds
Fed’s Term Auction Facility (TAF)
Troubled Asset Relief Program (TARP): U.S. Treasury and Fed purchased assets and equity from U.S. financial institutions
FDIC guaranteed new (senior) debt issues by banks
The following figure is from Blanchard, Macroeconomics (9th Edition, 2025), Chapter 6, Page 128
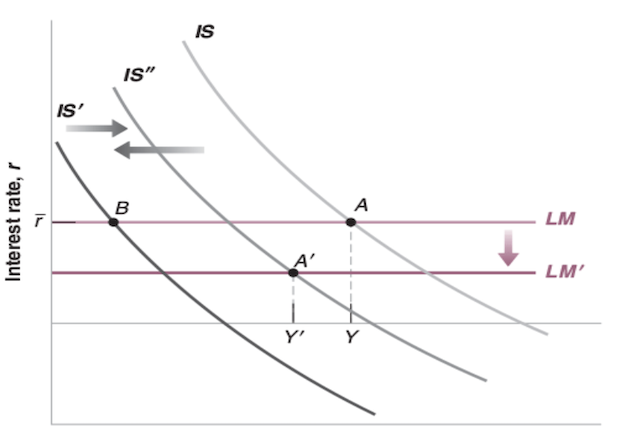
Decline in home and stock prices shifts IS left. is an equilibrium without policy interventions.
Expansionary monetary policy shifts LM down
Expansionary fiscal policy shifts IS right
Final equilibrium output, , is below pre-crisis level, (e.g., potential output)
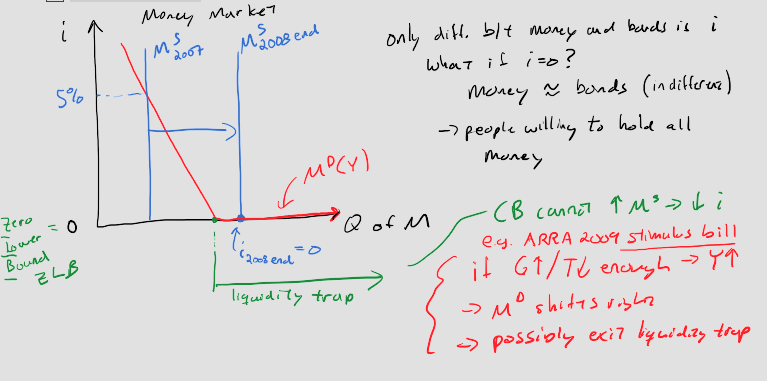
Liquidity Trap
Liquidity trap: central bank cannot lower the short-run nominal interest rate by increasing the money supply
Zero Lower Bound (ZLB): when the short-run nominal interest rate equals its lower bound, i.e., in U.S.
But central bank might still be able to lower longer-term interest rates
And central bank acting as “buyer of last resort” still helps provide liquidity to markets and prop up asset prices to improve balance sheets
Balance Sheet
Balance sheet: Assets = Liabilities + Equity
Assets store value at market prices (mark-to-market)
Liabilities are financial obligations to others
Equity is what’s left if you sold the assets and paid off all liabilities
Equity belongs to the owners of the firm
Equity for banks is known as bank capital
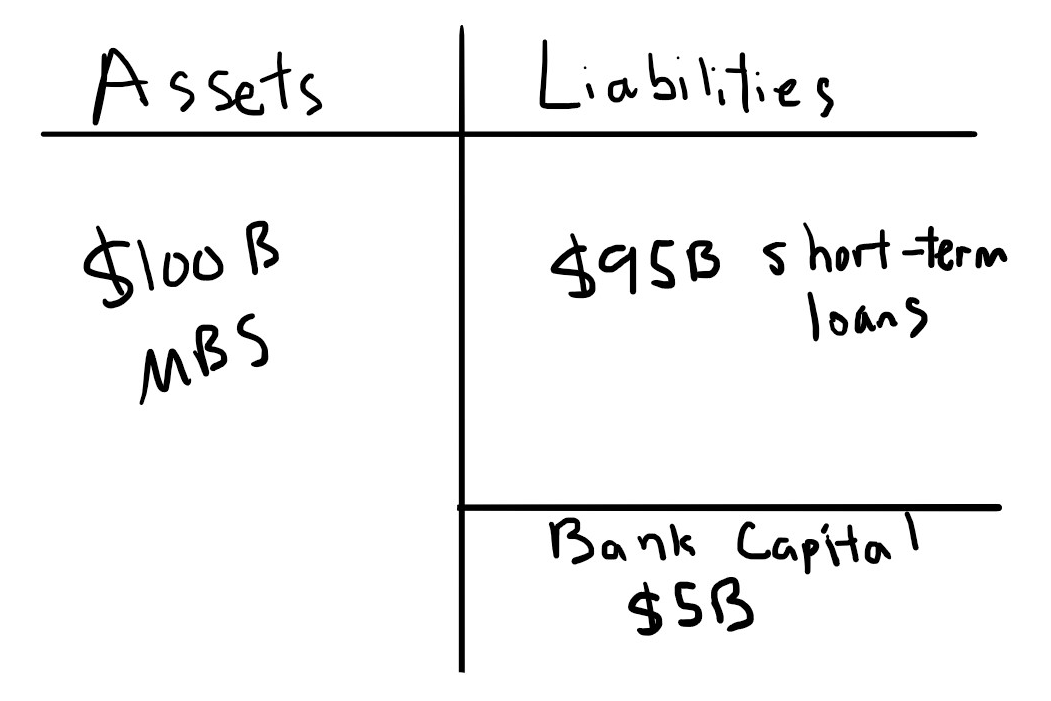
Bank Failure
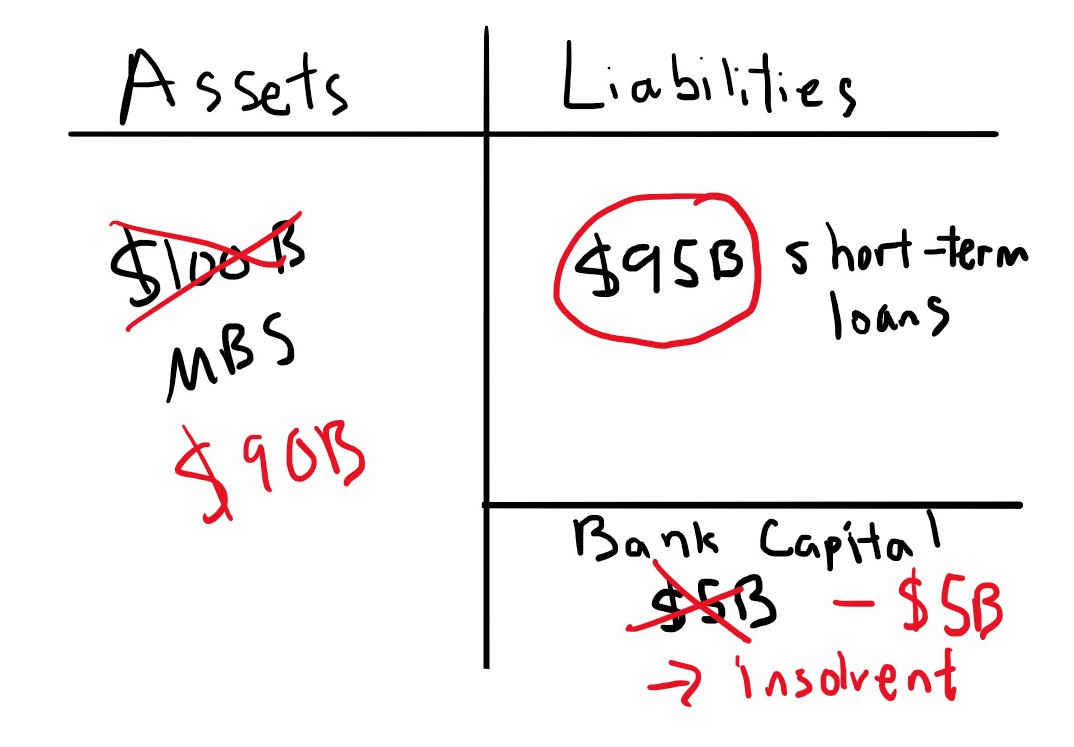
Suppose families become delinquent on mortgages
MBS (assets) fall in value by 10%.
mark-to-market: B in assets is now only B
Bank still owes B in short term
Equity/Bank Capital = Assets - Liabilities = B - B = B
Negative equity means the bank is balance-sheet insolvent
Capital Ratio
Capital Ratio = Bank Capital / Assets (Leverage Ratio = Assets / Bank Capital)
Investment banks were highly leveraged (e.g., leverage ratio = 30-40)
Thus, a small change (2-3%) in asset prices can threaten balance-sheet insolvency
In 2007, U.S. investment banks had no fixed minimum capital ratio like commercial banks, who are subject to capital requirements.
Regulators often close a commercial bank once its capital ratio falls below a critical threshold to protect depositors.
Balance-sheet insolvency can be resolved through
bankruptcy, which is easy for small banks and difficult for big banks
acquisition: big bank buys little bank, e.g., JP Morgan acquired Bearn Stearns investment bank (Mar 2008)
equity injection: somebody/thing gives capital to bank, increasing equity/bank capital
Different than Cash-flow insolvency: not enough cash on hand to pay creditors, which can be resolved by
transforming/selling assets, which if a lot of banks do, then asset prices fall
new liabilities, borrowing from other individuals, banks, or the Fed
new owners/equity injection, somebody/thing gives cash to bank and becomes an owner/increases ownership
Financial Crisis
In crisis, cash-flow in “dries up” and threatens cash-flow insolvency, e.g., delinquent mortgages reduce cash-flow on MBS and CDOs
Banks sell assets to get cash so they can stay cash-flow solvent
Banks sell other assets (not just ones related to mortgages) that still have value, which causes those prices to fall
A lot of banks selling a lot of assets is known as a fire sale and the assets become very illiquid because nobody wants to buy them
Also no one wants to (nor can even) loan to firms
Asset prices fall and reduce the value of existing assets on balance sheets, which threatens balance-sheet insolvency
Too Big to Fail: the insolvency of a big bank that would pose an existential threat to the financial system
Policies
The Fed acts as lender of last resort to provide loans to financial institutions so they stay cash-flow solvent
The Fed acts as buyer of last resort to provide liquidity to financial markets and prop up asset prices, which decreases chance of insolvency
Congress can approve loans to bail out banks and firms
Federal gov’t can become an owner of failing firms, e.g., Bear Sterns, Fannie Mae, Freddie Mac, and AIG (injecting equity and buying shares of stock)
Longer-term: increase capital requirements (lower leverage ratios, e.g., Basel Accords) to decrease chance of balance-sheet insolvency
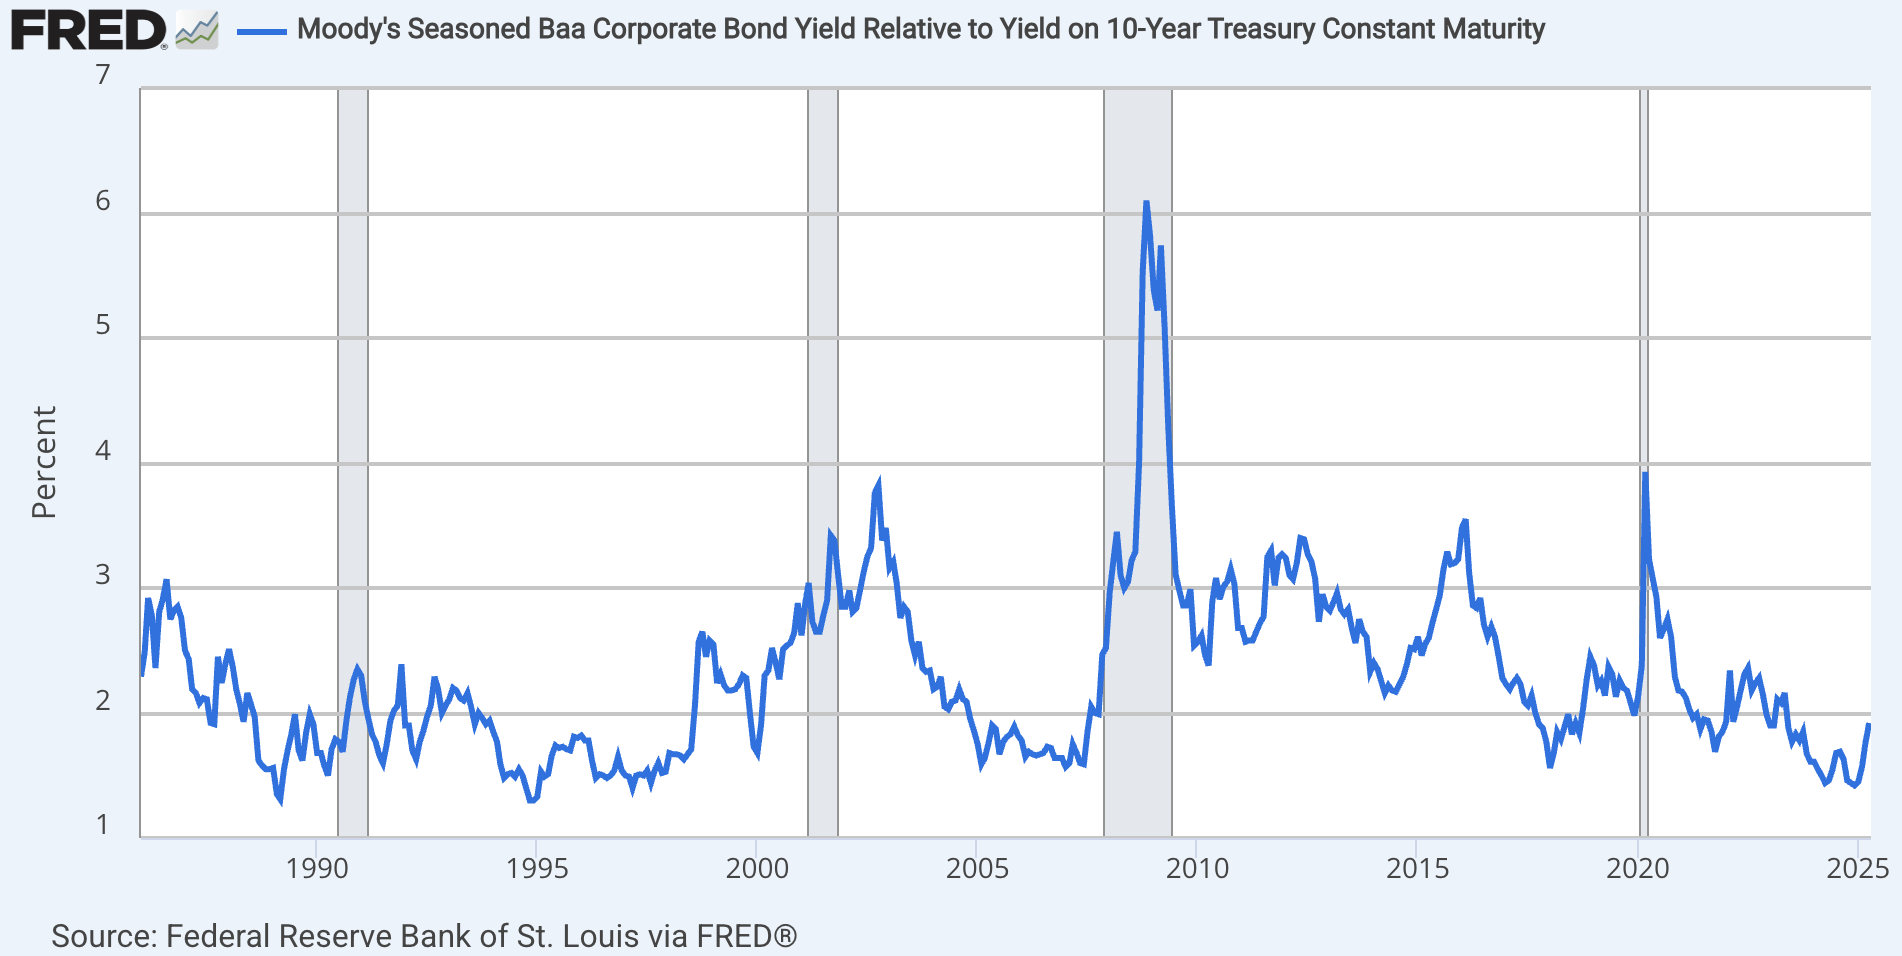
Risk Premium
We’ve talked a lot about short-term risk-free rate, e.g., Fed funds or 3mo U.S. T-Bill
Risk premium: additional interest to compensate lenders for default risk, i.e., credit risk
Also term/liquidity premium: additional interest to compensate lenders for risk of lending long-term
long-term assets are less liquid than short-term assets
Investor who wants to sell long-term asset is exposed to price volatility
These premiums are additional channels to influence investment/consumption
reduce risk premium by buying assets backed by riskier securities, e.g, MBS
reduce term premium by buying longer-term securities, e.g., Treasury bonds
Recall the goods market in a short-run equilibrium
Now lenders demand risk premium
increases in recessions as profits fall and loans dry up
Fed can lower by buying assets backed by (or lending collateralized by) riskier securities
The following figure is from Blanchard, Macroeconomics (9th Edition, 2025), Chapter 6, Page 121
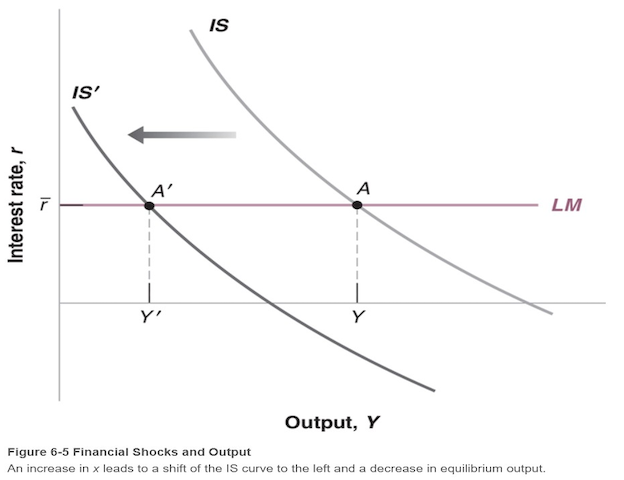
An increase in the risk premium raises the cost of borrowing to finance investment
For a given short-term risk-free rate, investment declines in the goods market
The IS curve shifts left
- Garcia, D. (2019). Second Home Buyers and the Housing Boom and Bust. Finance and Economics Discussion Series, 2019.0(29), 1–36. 10.17016/feds.2019.029